
Survey Results: Short Tenure for Higher Ed’s Top Leaders
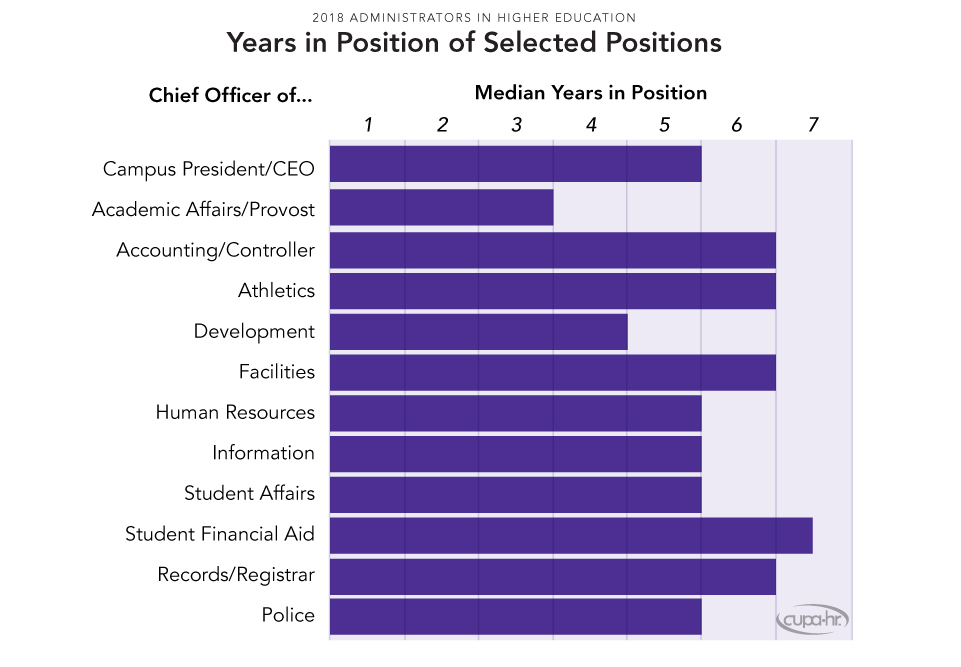
Presidents and provosts in U.S. colleges and universities tend to change jobs frequently; in fact, administrators in higher education overall tend to have fairly short tenures, with a median of five years in their position. Data from CUPA-HR’s 2017-18 Administrators in Higher Education Survey show that presidents have been in their current position for a median of five years, and provosts have an even shorter tenure, with a median of three years in their position.
This year’s survey also found that salary slightly decreases the longer administrators (overall) are in their current position. For most administrator positions, median salaries are at a peak for those who have 10 years in their current position, but decline after that. Top executives are the exception, as their salaries are more varied over a longer tenure. However, data show that top executives with six years in their current position are not making much more than those who are new.
Says Jackie Bichsel, CUPA-HR’s director of research, “It’s not surprising that administrators overall have a relatively short median tenure. Given that those with many years of tenure do not make considerably greater salaries, their best chance for a raise may be to find a new position.”
Select Findings
Here are some other findings from this year’s survey:
Salary Increases:
- The overall median salary increase for administrators in higher education over the past year is 2.2 percent.
- This increase is the lowest it has been for three years. The previous two years saw increases of 2.6 percent for administrators.
Pay and Perks:
- Deans in the health professions are the highest paid; those in special programs are lowest paid.
- Associate/assistant deans with faculty status are paid significantly more than those without.
- Higher ed system presidents saw an uptick in perks this year after a four-year downward trend.
Representation:
- Just over half (51 percent) of all higher ed administrators are women, but the majority of administrators at the highest levels are men.
- Women are better represented among deans with the lowest salaries than they are among deans with the highest salaries.
- Racial/ethnic minorities make up 15 percent of higher ed administrators.
Pay Equity:
- Across all administrators, women earn 82 cents on the dollar compared to men.
- Overall, minority administrators are compensated either equally or better than their White counterparts.
A total of 51,224 administrators were reported for 197 positions from nearly 1,200 institutions for this year’s Administrators in Higher Education Survey. In addition to salary data, the survey collects data on gender, race/ethnicity, age and years in position at the incumbent level for all administrators.
For a list of participating institutions, a report overview, information on data collected and options for purchasing the survey report and DataOnDemand, visit the Administrators in Higher Education web page.
Read about this year’s faculty survey findings around trend increases and diversity in the pipeline.
