
The Higher Ed Skilled Craft Workforce
By Melissa Fuesting and Anthony Schmidt | February 2021
Introduction
The skilled craft workforce possesses the in-demand, highly specialized skills that are necessary to maintain and improve campus. However, campus, the heart of many colleges and universities, may be in trouble: The higher ed skilled craft workforce is aging, and there are not enough younger workers to take the place of older employees as they retire.
In this brief, we begin with a focus on pay in the skilled craft workforce. Skilled craft positions are notable because they are well-paid relative to positions that require similar levels of education. Skilled craft positions can provide financial stability to individuals who do not have the opportunity or desire to go beyond an associate’s degree. We next examine the aging of the skilled craft workforce and discuss the skilled craft workforce’s strengths and opportunities for growth in the areas of diversity and equity. We close by recommending next steps for colleges and universities.
Taken together, we argue that aging in the higher ed skilled craft workforce provides a unique opportunity to work toward greater diversity and equity in this area, particularly as many colleges and universities are in a time of unprecedented change.
Skilled Craft Positions by Position Type
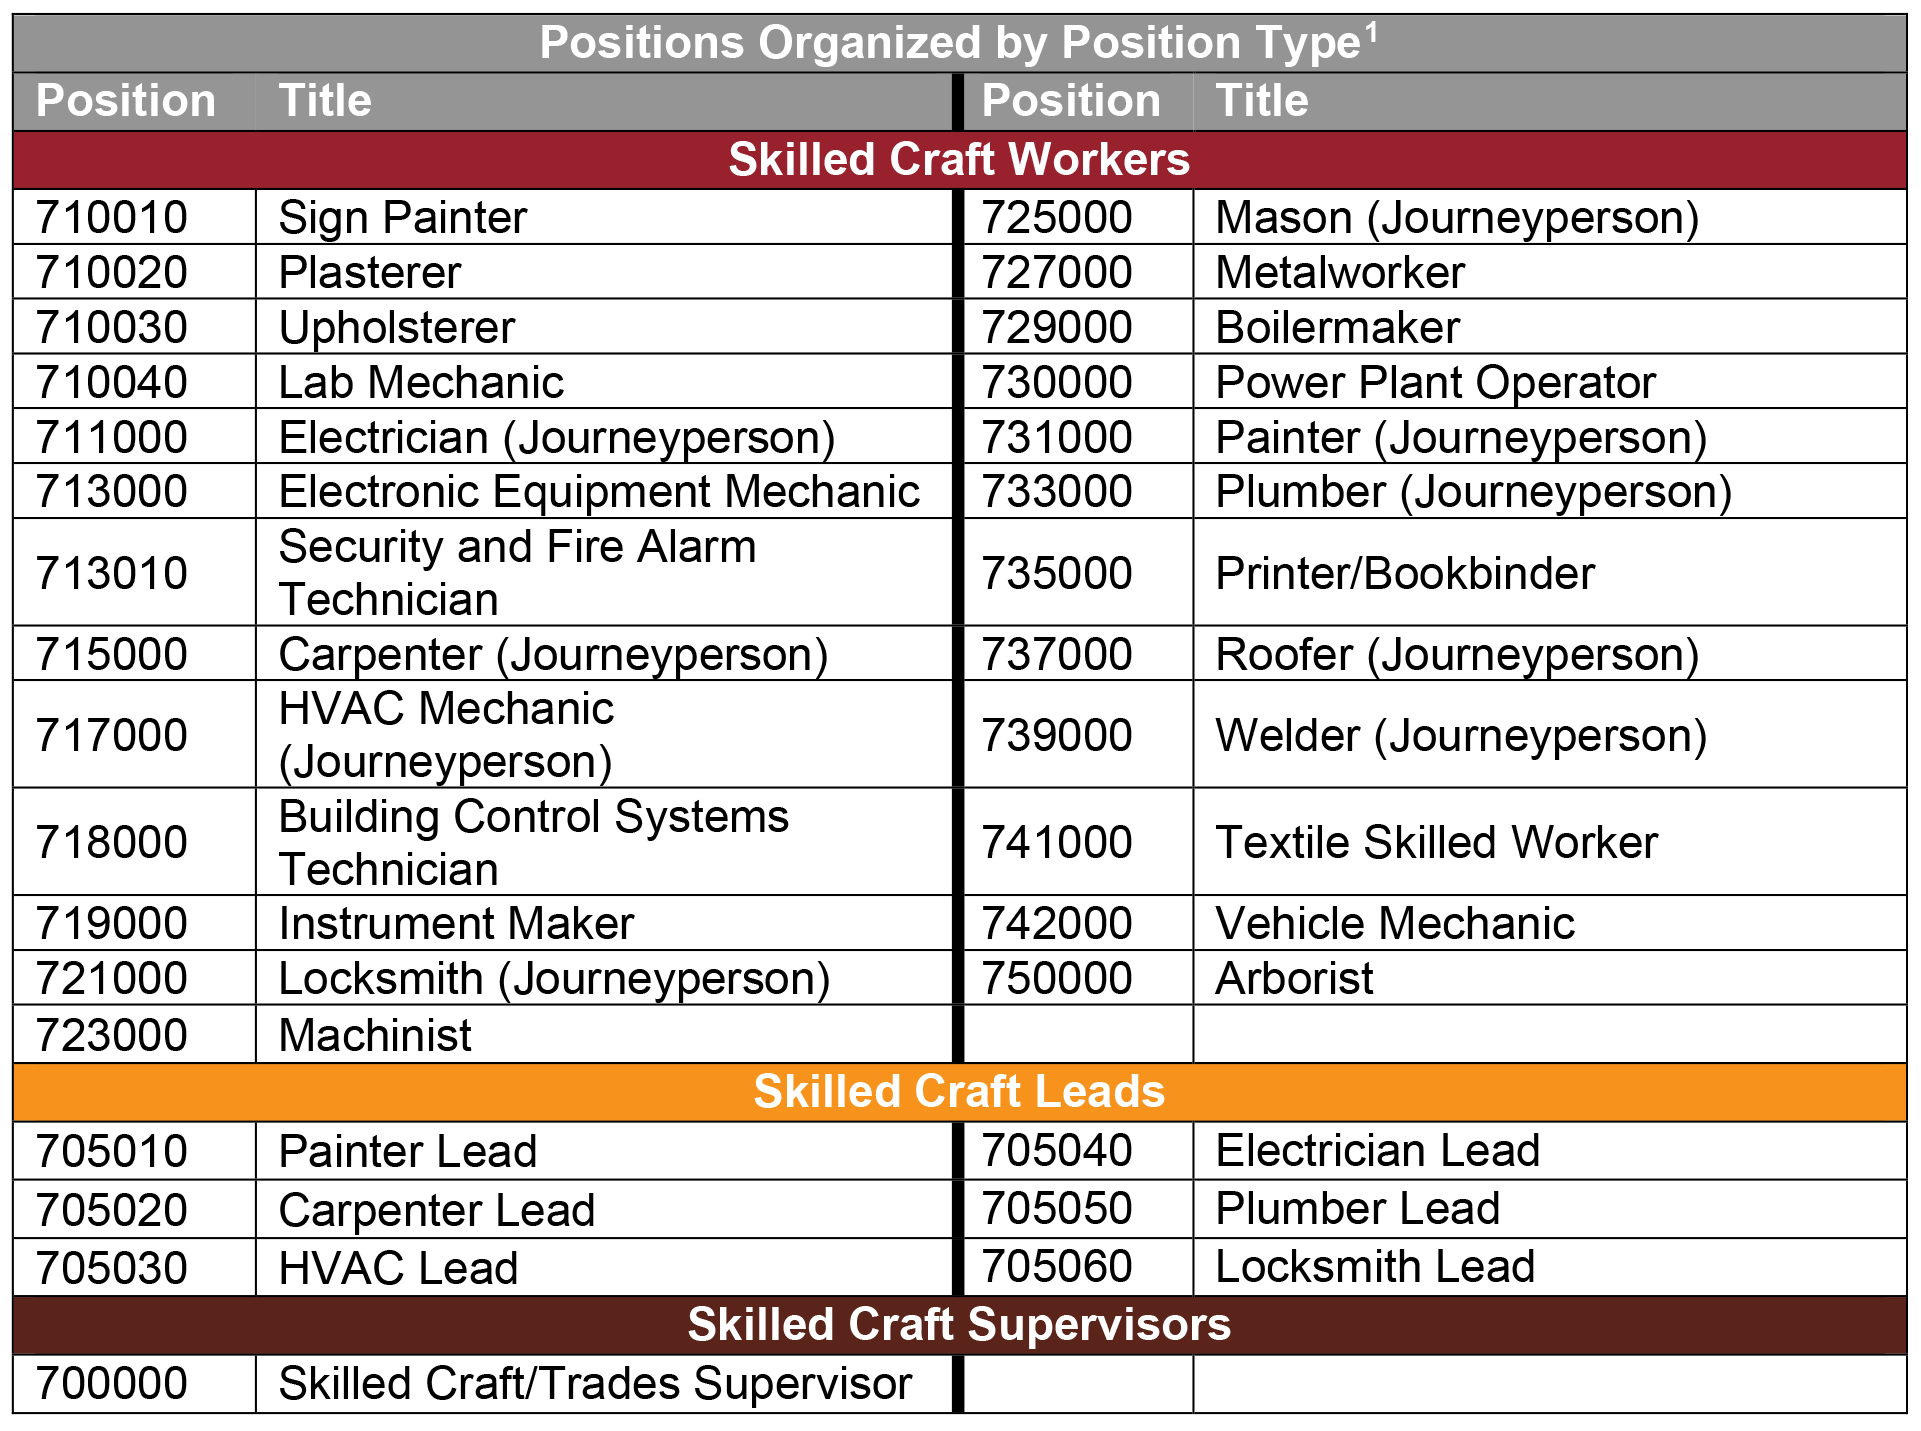
This brief analyzes data on 15,558 skilled craft employees reported by 675 institutions. For the purposes of this brief, we consider an employee as part of the skilled craft workforce if they are in one of 32 skilled craft positions, which we further organize into three position types (see Table 1 for position names and position types).
Skilled craft workers perform the skilled labor necessary to maintain and improve the physical facilities and infrastructure of a campus. Skilled craft leads assign, coordinate, and inspect the work of journeyperson-level skilled craft workers. Skilled craft supervisors hire, train, and supervise unskilled to highly skilled labor and may also perform skilled craft work themselves.
Table 1. Positions Organized by Position Type1All positions are collected in the Staff in Higher Education Survey except for skilled craft/trades supervisor, which is collected in the Professionals in Higher Education Survey. See the 2020 Survey Participation and Information Templates for each survey for full position descriptions.
Pay of the Skilled Craft Workforce
Median Salary by Position Type
Figure 1 shows the median salary of the skilled craft workforce by position type. Among skilled craft employees, supervisors are paid the highest median salary, followed by leads, and then workers.2Though staff are typically thought of as receiving pay rather than a salary, we collect staff pay as annual salaries by multiplying hourly wages by 2080. Collecting and reporting staff pay as annual salaries allows CUPA-HR to standardize pay within the survey and to make staff pay directly comparable to pay in our other surveys.
Skilled craft supervisors, leads, and workers do not require a postsecondary degree, but these position types all have higher median salaries than workers in the U.S. who hold a high school diploma ($38,844) or completed some college or an associate’s degree ($45,240).3CUPA-HR data in this brief have an effective date of November 1, 2019. To make comparisons between the higher ed workforce and the general labor force as parallel as possible, salary data from non-CUPA-HR sources have an effective date of Quarter 4, 2019. ,4Bureau of Labor Statistics (2020). Usual Weekly Earnings Summary (USDL-20-0611). Indeed, most (85%) of the skilled craft positions examined in this brief have median salaries higher than $45,240. In addition, most of these positions are eligible to earn overtime wages at a higher hourly rate.
Figure 1. Median Salary by Position Type
Highest-Paying Skilled Craft Positions
Figure 2 displays the skilled craft positions with the highest median salaries.5Use your subscription to Staff in Higher Education DataOnDemand to benchmark pay for skilled craft employees at your institution against a customized group of peer and aspirant institutions. As seen in Figure 1, skilled craft supervisors are paid the highest median salary. Three lead positions (electrician, HVAC, and plumber) are among the highest-paid skilled craft positions, but six of the 10 highest-paid skilled craft positions are skilled craft worker positions that do not require supervising others (e.g., lab mechanic, instrument maker).
Taken together, Figures 1 and 2 suggest that the skilled craft workforce is well-paid in comparison to U.S. workers with similar levels of education. The compensation of the skilled craft workforce, and particularly the positions in Figure 2, is due in no small part to employers competing to hire employees with such a highly specialized skillset.
Figure 2. Highest-Paying Skilled Craft Positions
Aging of the Skilled Craft Workforce
Age Distribution
Though one could anticipate that well-paid skilled craft positions (see Figures 1 and 2) might attract people of all ages, the skilled craft workforce in higher ed is aging. Figure 3 depicts the age distribution of the skilled craft workforce, which skews toward older employees. The median age of all employees in Staff Survey positions is 49, whereas the median age of the skilled craft workforce is 54.6Pritchard, A., Fuesting, M., Nadel-Hawthorne, S., Schmidt, A., & Bichsel, J. (2020). Staff in Higher Education Annual Report: Key Findings, Trends, and Comprehensive Tables for the 2019-20 Academic Year (Research Report). CUPA-HR. The median ages of skilled craft supervisors (54), leads (55), and workers (53) are similar.
Overall, most (56%) of the skilled craft workforce is concentrated between the ages of 50 and 65, and only 17% of the skilled craft workforce is under age 40. It is not common for skilled craft employees to work past normal retirement age. The concentration of employees begins to drop considerably after age 65. Only around 1% of skilled craft employees are over age 70.
Figure 3 suggests a crucial need for succession planning for skilled craft positions. Most of the skilled craft workforce is nearing retirement age, and there are relatively fewer younger employees in the pipeline to replace skilled craft employees as they retire.
Figure 3. Age Distribution of the Skilled Craft Workforce
Aging Within Journeyperson and Lead Positions
Figure 4 examines aging within each skilled craft position and displays the percentage of older workers (i.e., over age 55) who are approaching retirement age.7Figure 4 only displays positions with at least 50 reported employees. Succession planning efforts are necessary for many skilled craft positions. Forty-six percent of skilled craft supervisors are over age 55, and the pipeline positions to this position are also aging.
Painter leads, carpenter leads, boilermakers, locksmith leads, and printers or bookbinders show the greatest need for succession planning. Succession planning for painter, carpenter, and locksmith leads may be complicated by the fact that half or nearly half of employees in the corresponding journeyperson positions are over 55. Roofers and sign painters have the lowest concentration of older staff.8Use the Age Demographic Report included with your subscription to Staff in Higher Education DataOnDemand to benchmark the age of your skilled craft employees against a customized group of peer or aspirant institutions.
Figure 4. Percentage of Employees Over Age 55 by Position
Aging by State
Figure 5 shows the percentage of older skilled craft employees (those over 55) by state. Connecticut (61%), New Jersey (60%), and Minnesota (60%) are the states with the highest concentration of skilled craft employees over age 55, whereas Illinois (31%), Delaware (31%), and Nevada (18%) are the states with the lowest concentration of skilled craft employees over 55. Note that Nevada has a considerably lower concentration of older employees than the two states with the next lowest concentration of older employees.
Overall, the Northeast census region has the highest concentration of skilled craft employees over age 55 (48%), whereas the West census region has the lowest concentration of skilled craft employees over age 55 (39%). These patterns align with age in the general U.S. population: As of 2018, the Northeast census region had the highest median population age (40), whereas the West census region had the lowest median population age (37).9U.S. Census Bureau. (2019). 2018 Population Estimates by Age, Sex, Race and Hispanic Origin: Table 1 Median Age in 2010 and 2018 for the United States, Regions, and States.
Figure 5. Percentage of Skilled Craft Employees Over Age 55 by State
Representation of Racial/Ethnic Minorities and Women
Women and racial/ethnic minorities are notably underrepresented among skilled craft workers. Overall, 3% of the skilled craft workforce are women, and 17% of the skilled craft workforce are racial/ethnic minorities. In the U.S., approximately 51% of the population are women, and approximately 40% of the population are racial/ethnic minorities.10Bureau of Labor Statistics (2020). QuickFacts United States. ,11For the purposes of this brief, racial/ethnic minorities are defined as individuals who identify as American Indian/Alaska Native, Asian, Black/African American, Hispanic or Latino, native of Hawaii or other Pacific Islander, or two or more races/ethnicities.
The representation of women and racial/ethnic minorities in the skilled craft workforce varies by position type (see Figure 6).12Figures 6 and 7 report data on gender based on 702 supervisors, 1,378 leads, and 10,510 workers for whom gender data was reported. Figures 6 and 7 report data on racial/ethnic minorities based on 674 supervisors, 1,316 leads, and 9,985 workers for whom race/ethnicity was reported. The representation of racial/ethnic minorities is highest in lead positions. The representation of racial/ethnic minorities drops between lead and supervisor positions. The representation of women is extremely low in all skilled craft position types.13Use the Gender Demographic Report and Ethnicity Demographic Report included with your subscription to Staff in Higher Education DataOnDemand to benchmark representation of and pay for women and racial/ethnic minorities in skilled craft positions against a customized group of peer and aspirant institutions.
Figure 6. Representation of Racial/Ethnic Minorities and Women by Position Type
Pay Ratios for Women and Racial/Ethnic Minorities
Figure 7 shows median pay ratios for women and racial/ethnic minorities by position type.14Median pay ratios are controlled for position. For the pay ratios for women, median salaries by sex for each specific position were obtained; then the median of those medians was calculated for both men and women for each position type. For the pay ratios for racial/ethnic minorities, median salaries by minority status for each specific position were obtained; then the median of those medians was calculated for both racial/ethnic minority employees and White employees for each position type. This controls for the fact that women and racial/ethnic minorities are represented differently in specific positions that may pay higher or lower salaries, and it means that the wage gaps present are not explained by the fact that women or racial/ethnic minorities have greater representation in lower-paying skilled craft positions.
Women are paid less than men in every skilled craft position type. Women are paid substantially less equitably in lead positions, where they are paid only 80 cents on the dollar. Women have the highest pay relative to men in supervisor positions, but they are still paid only 97 cents on the dollar.
Overall, racial/ethnic minorities are paid less than White employees (96 cents on the dollar). Racial/ethnic minorities are paid more than White employees in lead positions but are paid less than White employees in worker and supervisor positions.
Position types that have a relatively lower representation of women also have relatively lower median pay ratios for women relative to men (see Figure 6). Similarly, position types that have a relatively lower representation of racial/ethnic minorities also have relatively lower median pay ratios for racial/ethnic minorities relative to White employees (see Figure 6). There is a clear need to focus on improving pay equity for women and racial/ethnic minorities in the skilled craft workforce.
Figure 7. Pay Ratios for Racial/Ethnic Minorities and Women by Position Type
Summary and Next Steps
The higher ed skilled craft workforce is well-paid in comparison to U.S. workers with similar levels of education, but this pay has not attracted enough younger workers to replace the older workers. The entire skilled craft workforce would benefit from recruiting more young workers coupled with succession planning (see Figures 3, 4, and 5). The need for more young workers and succession planning is particularly great within the Northeast census region and for painters, carpenters, boilermakers, locksmiths, and printers or bookbinders.
Efforts to replace skilled craft retirees should be combined with efforts to recruit workers from groups that are currently underrepresented. Racial/ethnic minorities and women are currently underrepresented in skilled craft positions relative to the general U.S. population. It is important to set diversity goals that are realistic given the diversity of the local talent pool, but current patterns of representation suggest that racial/ethnic minorities and women who enter skilled craft worker positions do advance into supervisory roles. Diversity for its own sake is an important goal: Diversifying the skilled craft workforce also fundamentally opens well-paying positions to more women and racial/ethnic minorities.
An essential piece of the puzzle of diversifying the skilled craft workforce is to ensure that more young people, and particularly young people from underrepresented groups, receive training in these highly specialized skills. Higher education leaders at institutions that train the next generation of skilled craft employees should consider the following:
- Does your institution have any formal efforts in place to recruit students from underrepresented backgrounds into skilled craft training programs?
- Does your institution currently work to open skilled craft apprenticeships to more women and racial/ethnic minorities? Jobs for the Future provides resources on how to get started.15Jobs for the Future. (n.d.). Diversity, Equity, and Inclusion in Apprenticeship & WBL (Online Resource).
Though skilled craft workers are well-paid, women are paid less than men in all skilled craft position types, and racial/ethnic minorities are paid less than White employees except for in lead positions. Lower pay relative to majority groups (i.e., male or White workers) may make it more difficult to recruit women and racial/ethnic minorities in skilled craft positions. Institutions should perform a targeted pay equity analysis on their skilled craft workforce to identify areas for improvement and gain insight into underlying reasons for disparities.16For an overview of pay equity analysis, watch our Seize the Day for Achieving Pay Equity in Higher Ed webinar.
In considering the findings in this brief, higher education leaders should consider the following:
- How do these data compare to data at your institution? Are the aging, diversity, and equity patterns similar or different?
- Does your institution currently have processes in place to recruit workers from underrepresented backgrounds into skilled craft positions? If your institution has general diversity recruitment procedures, could these be adapted to better suit recruiting for skilled craft positions?
- What will be necessary to design a succession plan for the skilled craft workforce at your institution? What are the strengths or opportunities for growth at your institution?
- What is the timeline for retirements in your institution’s skilled craft workforce? How soon must succession plans be developed?
- How can diversity and equity be best integrated into succession planning at your institution?
- Have you recently performed a pay equity analysis on your skilled craft workforce?
Citation for this report: Fuesting, Melissa, & Schmidt, Anthony. (2021, February). The Higher Ed Skilled Craft Workforce: Pay, Aging, Diversity, and Equity (Research Report). CUPA-HR.
Printer-friendly Version 1 All positions are collected in the Staff in Higher Education Survey except for skilled craft/trades supervisor, which is collected in the Professionals in Higher Education Survey. See the 2020 Survey Participation and Information Templates for each survey for full position descriptions.