
By Jacqueline Bichsel, Melissa Fuesting, Diana Tubbs, and Jennifer Schneider | September 2023
Introduction
The CUPA-HR 2023 Higher Education Employee Retention Survey (ERS) was conducted nearly one year after the pilot survey in 2022.[1] The pilot was created to better understand the factors underlying the retention crisis in the wake of the COVID-19 pandemic — the reasons higher ed employees were looking for other employment, the characteristics of those at risk for leaving, and what higher ed institutions could do to retain their employees. The results of the 2022 survey showed that retention was indeed a problem and that employees at risk for leaving saw themselves as overworked, underpaid, and not getting the remote work opportunities they desired.[2]
During the 2022-23 academic year, voluntary turnover for higher ed staff was the highest it has been since CUPA-HR started tracking it in 2017-18.[3] For full-time, exempt staff, turnover has increased from a low of 7.9% in 2020-21 (the academic year after the pandemic began) to 12.0% in 2021-22 to 14.3% in 2022-23. Turnover for full-time, non-exempt staff increased from 9.4% to 12.8% to 15.2% during this same period. Given the fact that voluntary turnover is only increasing, CUPA-HR decided to administer the ERS again in 2023 to assess the proportion of the workforce that remains at risk for leaving, understand how the retention picture has changed, and provide recommendations for what higher ed leaders can do to increase the retention of their workforce.
The 2023 survey asked questions in the following areas:
- Likelihood of looking for other employment opportunities in the near future
- Reasons for looking for other employment
- Remote work policies and opportunities
- Work performed beyond normal hours and duties (overwork)
- Satisfaction with benefits
- Well-being and satisfaction with the job environment
- Retention incentives experienced in the past year
- Challenges for supervisors
- Demographic questions on gender, race/ethnicity, and age
- Characteristics of the employee’s position
The survey was targeted to all higher ed employees who are not faculty — administrators, professionals, and non-exempt staff. Notice of the survey was distributed through members of CUPA-HR and other professional organizations.[4]
This comprehensive report describes the results obtained from each section of the survey. Analyses provide an overview of what proportion of the higher ed workforce is at risk of leaving, why employees are considering other job opportunities, and the factors that underlie their desire to leave. A model of higher ed retention is presented that includes the variables on which higher ed leaders should focus to move the needle on turnover and improve retention of talent. Differences by institution characteristics, employee demographics, and employee department/area are portrayed where these differences are notable or compelling and where there are adequate response numbers to enable reliable reporting.
Respondents
We analyzed data from 4,782 higher ed employees for this report.[5] Approximately 40% of respondents were supervisors, who had a median of four staff reporting to them. Nearly all (97%) respondents worked full-time, and 75% reported they were exempt. The median age of all respondents was 45. More than three-fourths (76%) of respondents were female, and more than two-thirds (69%) were White (Figure 1).[6] This year’s survey was more representative of Hispanic or Latina/o men and women than was last year’s survey. In addition, these gender and race/ethnicity demographics align with what is reported in CUPA-HR’s workforce surveys with the exception that men in general are underrepresented in the ERS.[7]
Figure 1. Gender and Race/Ethnicity of Respondents
Respondents worked in many different departments/areas (Figure 2). The area with the highest representation in the survey was academic affairs (17%), followed by student affairs and administration (both 12%).[8]
Figure 2. Respondent Departments/Areas
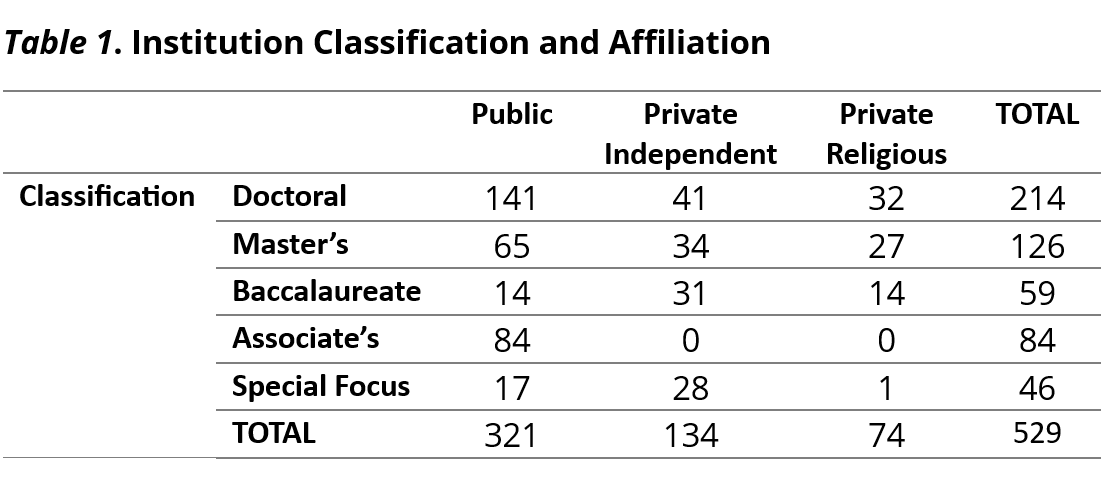
Respondents represented 529 institutions. Table 1 provides general information on the characteristics of the institutions represented in this survey.[9]
The Likelihood of Looking for Other Employment Opportunities Remains High
The first question in the survey asked about the likelihood of looking for other employment opportunities within the next year. Response options ranged from “Very Likely” to “Very Unlikely” (Figure 3). Overall, one-third (33%) of higher ed employees are very likely or likely to look for new employment opportunities in the next year (red colors on Figure 3), which is unchanged from last year.[10] These results indicate that retention remains a major challenge in higher ed. The area with the most acute retention challenge is student affairs, where 39% of employees surveyed say they are likely or very likely to look for other employment opportunities within the next year.
Figure 3. Likelihood of Looking for Other Employment Within the Next 12 Months
We compared mean (average) “likelihood of looking” scores to see if there were demographic differences in retention. The likelihood of looking for other employment varies with age. Figure 4 shows a clear pattern where younger employees have a higher mean likelihood score than do older employees. Those employees under the age of 45 (M = 3.13, SD = 1.38) are significantly more likely to look for other employment in the next 12 months compared to those who are 45 or older (M = 2.57, SD = 1.35).[11] These results are consistent with what we found in 2022.[12]
Gender and race/ethnicity are also related to the likelihood of looking for other employment opportunities. Men (M = 3.02, SD = 1.43) reported they are significantly more likely to look for other employment in the next 12 months compared to women (M = 2.82, SD = 1.38).[13] In addition, employees of color (M = 3.17, SD = 1.42) reported they are significantly more likely to look for other employment compared to White employees (M = 2.73, SD = 1.36).[14]
Figure 4. Likelihood of Looking for New Employment by Age
We also asked where higher ed employees who are likely to seek new employment plan to look for these opportunities (Figure 5).[15] Responses included another higher ed institution (71%), a private for-profit company (61%), a non-profit organization outside of higher ed (49%), and their current institution (44%). The overall data are similar to results from last year. Notably, many employees are looking for employment either within their own or at another higher ed institution, indicating that appropriate retention measures could be successful. In other words, these employees are not looking to flee higher ed.
Figure 5. Where Employees Plan to Look for Other Opportunities
The reasons why higher ed employees are seeking new work opportunities remain similar to those from 2022 (Figure 6). By far, a pay/salary increase is the most cited reason that employees seek other employment.[16] Other influential reasons are an opportunity to work remotely, desire for a promotion or more responsibility, and the need for a more flexible work schedule.[17]These are similar to the reasons workers across the United States quit their jobs in 2021 and have also been cited as effects of the COVID-19 pandemic that are affecting organizations for the foreseeable future.[18][19]
Figure 6. Reasons Employees Are Seeking New Opportunities
Remote/Hybrid Work: Gaps Remain Between What Exists and What Employees Want
Despite the fact that remote or hybrid work has become more commonplace post-pandemic, there remain large disparities between employees’ preferences for remote/hybrid work and what their actual work arrangements are.[20] Our questions on work preferences and actual work arrangements reveal gaps between higher ed employees’ preference for remote/hybrid work and the current on-site-dominant work arrangements that are required of many employees (Figure 7).[21]
Employees’ preferred work arrangements remain virtually unchanged from last year. Fewer than one-third of employees prefer each of the two extremes — working nearly always on site or working nearly always remotely. The most common preference is for a hybrid work arrangement — partially on-site and partially remote. Although more than two-thirds (68%) of employees strongly agree or agree that most of their job duties could be completed remotely, current work arrangements are most likely to be completely or mostly on-site (66%). Only a quarter (24%) of current arrangements are hybrid (combining on-site and remote workdays) and a mere 11% are completely or mostly remote work arrangements (Figure 7). Fewer employees report having completely or mostly remote work arrangements this year (11%) compared to 2022 (14%).
In summarizing these results, remember the two-thirds rule: Two-thirds of higher ed employees believe most of their duties can be performed remotely and two-thirds would prefer hybrid or remote work arrangements, yet two-thirds are compelled to work mostly or completely on-site.
Figure 7. Current and Preferred Work Arrangements
Work arrangements unsurprisingly vary widely by department. Three-fourths or more of employees who work in financial aid, external affairs/development, enrollment management, and administration agree that most of their duties can be performed remotely, but very few indicate they are working completely or mostly remote. Institutional research (30%) and information technology (26%) are the departments most likely to have completely or mostly remote employees, whereas facilities/materials management/operations, student affairs, and library are the least likely (3%).
The work arrangement that is the most preferred continues to be a hybrid model (41%).[22] However, this also varies by department. Information technology, institutional research, and human resources employees most often prefer a completely or mostly remote work arrangement, and employees in facilities/materials management/operations and the library most often prefer a completely or mostly on-site work arrangement (Figure 7).
There is a persistent gap between current work arrangements and preferred work arrangements. Two-thirds (66%) of employees currently work completely or mostly on-site despite less than one-third (31%) preferring to do so. The gap between current work arrangements and employee preferences is consistent across all departments. There is a difference of at least 24 percentage points in every department between those who currently work mostly or entirely on-site and those who prefer such an arrangement. Notably, financial aid and student affairs exhibit the largest discrepancy, as over two-thirds of employees in these fields (68% and 77%, respectively) work completely or mostly on-site whereas only 24% and 35%, respectively, prefer to do so. Further, although information technology has the largest number of employees working completely or mostly remote (26%), more than half (51%) of information technology employees prefer completely or mostly remote work. Addressing this misalignment in work arrangements may serve as a valuable tool for enhancing employee retention, particularly for lower paying jobs.[23]
In examining the intersection of whether duties can be performed remotely with current and preferred work arrangements, several trends emerge. Among those respondents who strongly agree or agree their duties can be performed remotely, over half (53%) of employees work completely or mostly on-site even though only 14% prefer this arrangement. Further, just 16% of employees currently work completely or mostly remote even though 41% prefer remote work.
Preferred work arrangements vary somewhat by employee characteristics. Men most commonly prefer completely or mostly on-site work (43%) compared to women (27%). Additionally, employees of color are less likely to prefer completely or mostly on-site work (23%) compared to White employees (35%). When examining the intersection of gender and race/ethnicity, nearly half (47%) of White men prefer working completely or mostly on-site, whereas only one-fifth (20%) of women of color share the same preference. These findings highlight the significance of employee demographics in shaping work arrangement preferences in the higher education sector.
Half of Higher Ed Employees Work Additional Hours Beyond Full-Time Expectations
Half (50%) of higher ed employees work hours in addition to what is expected of full-time employees at their institution (Figure 8). Although this is a large percentage, it is much improved from the two-thirds of employees reporting additional hours in 2022.[24] About one-fifth (21%) of employees who work additional hours put in between one and five additional hours per week. However, an additional one-fifth (18%) put in between six and ten additional hours per week. About 6% of higher ed employees work 16 or more additional hours per week.
Of the 13 departments/areas analyzed, human resources (HR) has the highest percentage of employees working additional hours (60%), followed by student affairs (56%) and financial aid (54%). Three in five HR employees work additional hours, and nearly one quarter (24%) of HR employees work between six and ten additional hours each week beyond what is expected of full-time employees at their institution.
Figure 8. Distribution of Weekly Additional Hours Worked by Department/Area
There is sufficient sample size in both 2022 and 2023 to compare additional hours worked overall and for each of the seven departments shown in Figure 9. The percentage of employees working additional hours declined between 2022 and 2023, and this is true for all department/areas pictured except for financial aid, where the amount of employees working additional hours remained unchanged.
The largest decrease in additional hours worked between 2022 and 2023 was in fiscal/business affairs, where 71% of employees reported regularly working additional hours in 2022, and only 46% reported working additional hours in 2023. The smallest percentage change other than financial aid was in HR, where 70% of employees worked additional hours in 2022, and 60% worked additional hours in 2023. In higher ed, HR employees are the most likely to work additional hours, and they also have the smallest improvement in additional hours worked within the past year.
Figure 9. Additional Hours Worked in 2022 and 2023 by Department/Area
Supervisors (employees who have at least one direct report) are far more likely to work additional hours than are non-supervisors (Figure 10). Seven in ten supervisors (70%) work more hours than what is expected of full-time employees at their institution, whereas fewer than four in ten (36%) non-supervisors work additional hours. Eleven percent of supervisors work 16 or more additional hours each week, whereas only 3% of non-supervisors do. Following patterns for employees overall (see Figure 10), since 2022, the percentage of supervisors working additional hours declined from 81% in 2022 to 70% in 2023.
Figure 10. Distribution of Weekly Additional Hours Worked by Supervisors and Non-Supervisors
Supervisors likely work additional hours for several reasons explored in Figures 11 and 12. Nearly double the percentage of supervisors versus non-supervisors agree that it is normal to work weekends and that they cannot complete their job duties working only their institution’s normal full-time hours (Figure 11).
Figure 11. Work Demands for Supervisors and Non-Supervisors
Other reasons for supervisors’ heightened hours are that supervisors are more likely than non-supervisors to absorb the duties of staff who leave their institution (Figure 12). Supervisors are also more likely than non-supervisors to have experienced an increase in job expectations within the past year. These data show that — similar to patterns seen last year — supervisors continue to bear the brunt of absorbed duties and increased job expectations.[25]
Figure 12. Changes in Work Expectations Over Past Year for Supervisors and Non-Supervisors
Supervisors’ Top Challenges Are Filling Positions and Maintaining Morale
Supervisors responded to several items that explored the challenges they are experiencing in their roles (Figure 13). More than half (52%) of supervisors find filling empty positions very challenging, and more than one-third (35%) find maintaining staff morale very challenging. Nearly one-third of supervisors also find managing staff workload and retaining staff very challenging. Notably, only 8% of supervisors view managing remote staff as very challenging, with 61% reporting it is not a challenge. The relative order of these challenges has not changed since 2022. However, the percentage of supervisors reporting these as very challenging has declined substantially, indicating that these challenges have abated somewhat during the past year.[26] Nevertheless, it is clear that retention challenges remain for many in supervisory positions.
Figure 13. Supervisor Challenges
Supervisors With Institutional Support Are Less Likely to Seek Other Employment
When supervisors have a) the power to advocate for their staff, b) resources and support in their role, c) adequate management training, and d) the power to make decisions about their staff’s schedule flexibility, they are less likely to seek other employment. Table 2 presents the results of a multiple regression analysis that explores whether the variables of management training, resources and support, and three aspects of power (power to advocate for their staff, power to allow flexible schedules, and power to allow remote work) predict the likelihood that supervisors will seek other employment opportunities in the next year.[27] Multiple regression allows us to explore whether each variable uniquely predicts supervisors’ likelihood of seeking other employment (as it controls for each of the other predictors included in the analysis). Multiple regression also allows us to determine whether certain variables are relatively stronger predictors of retention.
Table 2 presents the multiple regression analysis results. Predictors that are stronger have larger absolute values (i.e., values further from zero, whether in a positive or negative direction) for the standardized beta coefficient (β; column 3 of Table 2). Each beta coefficient is negative, meaning that the greater agreement with that particular predictor, the less likely supervisors are to seek other employment opportunities. For example, the more power a supervisor has in advocating for their staff, the less likely they are to look for other employment.
All variables except the power to allow staff to work remotely significantly predict retention. Supervisors are less likely to seek other employment if they have more power to advocate for their staff, receive more resources and support in their supervisory roles, receive adequate management training, and have more power to allow flexible schedules for their staff. Of these, the strongest (and most important) predictor is the power to advocate for their staff. Conclusions from this analysis are — for the most part — similar to the conclusions of an identical analysis conducted on the 2022 Employee Retention Survey data.[28]
In sum, both this year and last year’s results provide converging evidence that giving supervisors the power to advocate for their staff and ensuring adequate support and resources in their supervisory role are important in their retention. Our current data show that only 69% of supervisors feel as though they have the power to advocate for their staff, and only 60% of supervisors agree that they have adequate resources and support in their supervisory role.

Notable Areas of Discontent Exist When It Comes to Job Satisfaction
Work Environment
Only 58% of higher ed employees are generally satisfied with their jobs (Figure 14).[29] This represents a four-percentage point decrease compared to 2022 results, where 62% expressed general job satisfaction. Higher degrees of satisfaction exist when employees are asked about specific aspects of their work environment. For example, four out of five employees (80%) agree they have a good relationship with their supervisor and that their work has purpose (Figure 14).
However, notable areas of discontent exist. Only 55% of employees agree that they are recognized for their contributions. In addition, nearly two out of five feel they aren’t able to bring up problems or tough issues at work, and the same number do not feel a sense of belonging.
Most strikingly, employees reported profound disagreement that they are paid fairly. More than half (53%) of respondents disagreed or strongly disagreed that they are being paid fairly. This marks a seven-percentage point increase from the previous year’s results on that same item.[30] Employees of color (M = 2.39, SD = 1.23) are significantly less likely to agree they are paid fairly than are White employees (M = 2.75, SD = 1.25), t(2710) = 9.08, p < .001.[31] Moreover, employees in academic affairs, student affairs, facilities/materials management/operations, and the library are least likely to agree that they are paid fairly.
Figure 14. Satisfaction With Work Environment
Institutional Environment
When we look more broadly at the institutional environment, employees’ responses are slightly less favorable compared to their satisfaction with their immediate work environment (Figure 15). A notable aspect of dissatisfaction revolves around their institution’s support for their professional growth. Almost half of employees (44%) express disagreement when asked whether they have opportunities for advancement at their institution, and around one-third (34%) disagree that their institution invests in their career development. Moreover, more than one-fourth of respondents (28%) disagree that their institution’s leaders show they care about their mental health and well-being.
Figure 15. Satisfaction With Institutional Environment
Troublingly, 11% of employees currently disagree that they feel safe from violence and crime in their workplace, compared to just 6% in 2022.[32] The employees feeling the least safe at work are those working at the library (19% disagreement), academic affairs (14%), and student affairs (14%). Further, employees of color feel less safe from violence and crime at work than do White employees, and women feel less safe than do men.[33] These findings underscore that not all employees feel secure in their work environments.
Understanding department trends can aid institutions in identifying specific areas they may need to focus on to enhance overall employee satisfaction and foster a positive work environment. Health/wellness/counseling services and human resources stood out among the departments as having the highest job satisfaction levels (67% agreement) and above-average responses to all work environment and institutional environment items. Conversely, employees working in the library and facilities/materials management/operations departments report the lowest job satisfaction levels (54% and 53% agreement, respectively).[34]
Employees of color have significantly lower agreement across all but three satisfaction items compared to White employees.[35] Besides the fair pay and safety from crime/violence items mentioned earlier, the items that had particularly striking differences by race/ethnicity were feelings of safety from infections/health problems at work and the ability to bring up problems and tough issues at work.[36] Women (M = 3.58, SD = 1.07) also did not feel they could bring up problems and tough issues at work compared to men (M = 3.67, SD = 1.08, t(4,531) = 2.55, p = .011).[37]
Employees Are Not Satisfied With Benefits That Provide Better Work-Life Balance
More than three-fourths of employees express satisfaction with their paid time off, health insurance, and retirement benefits (Figure 16).[38] However, benefits that more clearly align with better work-life balance, such as remote work policies, childcare benefits, schedule flexibility, and parental leave policies, continue to receive the highest levels of dissatisfaction. Notably, fewer respondents reported dissatisfaction with childcare benefits in 2023 compared to 2022, with only 28% expressing discontent in 2023 compared to 37% in 2022. Additionally, satisfaction with retirement benefits decreased slightly, from 81% satisfaction in 2022 to 76% in 2023.
Figure 16. Satisfaction With Benefits
Employees are least satisfied with their remote work policy. Upon delving deeper into the responses of those employees who strongly agree or agree that their duties can be performed remotely, this dissatisfaction becomes more pronounced. Among those who currently work completely or mostly on-site, more than half (54%) express dissatisfaction with their institution’s remote work policy. In contrast, only 23% of employees who have a hybrid arrangement and 9% of those who work completely or mostly remotely expressed dissatisfaction with their remote work policy. This highlights the need for a more comprehensive and flexible approach to remote work policies that better aligns with employees’ preferences and duties and contributes to overall job satisfaction (Figure 17).
Figure 17. Current Work Arrangement by Satisfaction With Remote Work Policy
Satisfaction with benefits varies by institution type (Figure 18). Employees at public and doctoral institutions report the highest satisfaction levels, whereas those at private institutions and associate’s or baccalaureate institutions have comparatively lower satisfaction with their benefits. Most noteworthy, public institutions show higher satisfaction with retirement (M = 3.99, SD = .90) and health insurance (M = 4.02, SD = .99) compared to private institutions (M = 3.57, SD = 1.15, t(1,287) = 10.51, p < .001 and M = 3.51, SD = 1.16, t(1,269) = 12.26, p < .001 respectively). The most significant variation by classification is found in satisfaction with the parental leave policy, with 44% of employees at doctoral institutions expressing satisfaction, compared to only 21% of employees at associate’s institutions.
Satisfaction with benefits by race/ethnicity reveals White employees report higher satisfaction levels with benefits such as paid time off (81% very satisfied or satisfied), retirement (77%), schedule flexibility (62%), and remote work policies (47%) compared to employees of color (76%, 73%, 55%, and 39% respectively, p < .05). However, employees of color express higher satisfaction with health insurance (M = 4.00, SD = 1.01) compared to White employees (M = 3.88, SD = 1.06), t(2,741) = 3.45, p = .001. Regarding gender, women express higher satisfaction with retirement benefits, tuition, health insurance, and paid time off, and men report greater satisfaction with schedule flexibility, parental leave policy, and childcare benefits (p < .05).
Figure 18. Satisfaction With Benefits by Classification and Affiliation
Few Higher Ed Employees Are Receiving Common Retention Incentives
A new question on this year’s survey asked respondents if they had received certain retention incentives in the past year (Figure 19).[39] Surprisingly, only slightly more than half of employees stated they received the two most common retention incentives: regular verbal recognition for doing good work (59%) and a pay increase (53%). The other retention incentives surveyed were even less common.
Figure 19. Retention Incentives Received in the Past Year
The Strongest Predictor of Retention Is Job Satisfaction
Throughout this report, we hold the premise that a good proxy for retention is the likelihood of looking for other employment. It is important to engage current employees in a regular dialogue about their satisfaction with their work environment, pay, and benefits, as outlined in the previous sections of this report. Waiting to ask an employee why they are leaving during an exit interview is too late to implement incentives, and exit interviews provide little indication of the dissatisfaction that exists among remaining employees. In this section, we provide a model that shows which variables are the strongest predictors of retention.
We start by looking at the correlations between each item of the survey and the likelihood of looking for other employment. These correlations are displayed in Table 3 in order of strength. Every item was significantly correlated with the likelihood of looking for other employment except for the number of direct reports the employee has. The strongest correlate of retention is general job satisfaction. As job satisfaction increases, the likelihood of looking for other employment decreases.

The problem with simply looking at correlations in isolation is that many of the items are correlated with one another, making it difficult to discern the independent contribution of each item in predicting retention. We therefore performed a factor analysis to see which of the survey variables “hang together” (i.e., highly correlate with one another).[40] The analysis found a total of seven factors, labeled and summarized in Table 4.[41] These factors are Job Satisfaction/Well-Being, Overwork, Safety/Confidence in Leadership, Satisfaction With Traditional Benefits, Increased Demands/Responsibilities, Remote/Flexible Work, and Satisfaction With Parental Benefits.
The benefit of a factor analysis is that it boils down a large number of items into factors that are better understood and are not redundant with each other. Each factor is listed with the items that “load” on it. Item loadings indicate the strength with which the items load on the factor. For example, Job Satisfaction/Well-Being is the factor with the most items underlying it. The strongest item that underlies Job Satisfaction/Well-Being is whether an employee feels recognized for their contributions, followed by feeling valued by others at work. In looking at individual item correlations (Table 3), we saw that general job satisfaction has the highest correlation with the likelihood of looking for other employment. However, the fact that general job satisfaction correlates so strongly with many other items obscures a detail that factor analysis uncovers: The most important facets of job satisfaction are recognition and feeling valued.

The next step is to assess how strongly each of these identified factors predict retention (the likelihood of looking for other employment). We do this using a multiple regression analysis. As explained in a previous section, multiple regression allows us to assess the relative strength of the predictors of retention. We entered each of the identified factors into a simultaneous multiple regression, along with age and whether employees believe they’re being paid fairly, to see whether and how strongly they predict the likelihood that employees will look for other employment. The results are presented in Table 5 in order of their strength of prediction.
In looking at the standardized beta weights (column 3), we see that Job Satisfaction/Well-Being is the strongest predictor (by far) of retention. In other words, as job satisfaction increases, the likelihood of looking for other employment decreases. The second largest predictor of retention is Increased Demands/Responsibilities. As demands and responsibilities increase, so too does the likelihood of looking for other jobs. This is followed closely by the perception of being paid fairly. Those employees who feel as though they’re being paid fairly are going to be less likely to look for other employment. Every variable entered into the regression was a significant predictor except for Satisfaction With Traditional Benefits (health insurance, retirement, paid time off, and tuition benefits, as outlined in Table 4).

Figure 20 provides a graphical depiction of our retention model. The size of the circles is directly proportional to the strength of the prediction of each factor or variable. This model is an indicator of where the direction of resources will provide the greatest opportunity to increase employee retention. Those looking to make sizeable inroads in attenuating a retention crisis at their institution would be best served to direct most of their resources to improving job satisfaction and well-being (attending to the items that underlie it outlined in Table 4).
Figure 20. Predictors of Retention
Conclusions
Retention continues to be a problem. The percentage of higher ed employees who are at least somewhat likely to look for new employment in the next year is unchanged from 2022. More than half (56%) of employees are at least somewhat likely to look for other jobs, and one-third (33%) are likely or very likely to look for other employment.
Younger employees, men, and people of color are more likely to leave. Employees under the age of 45 are significantly more likely to look for other employment than employees 45 and older. In addition, men and employees of color are significantly more likely to look for other employment opportunities.
Employees are looking for employment in a variety of locations, and the primary reason they say they’re looking is to obtain a pay increase. Although six in ten employees are looking for employment outside of higher ed, seven in ten are looking for opportunities in another higher ed institution, and more than four in ten are looking for other opportunities within their own institution. In addition, the most powerful reason for looking for other employment (by far) continues to be a pay increase.
There continues to be a gap between the remote/hybrid work arrangements that employees want and what higher ed leaders provide. Although two-thirds of employees state that most of their duties could be performed remotely and two-thirds would prefer hybrid or remote work arrangements, two-thirds of employees are working completely or mostly on-site.
Half of employees report they are working more than full-time hours, likely because they are still absorbing the responsibilities of staff who have left and responding to increased job expectations and demands. Although this percentage is much improved from last year, when two-thirds of employees reported working additional hours, this number remains large. In addition, supervisors are bearing the brunt of additional hours worked. They are more likely to work weekends, have duties that require additional time, absorb other staff’s responsibilities, and experience an increase in expectations and demands from their own supervisors.
Supervisors need power, resources, support, and training. When empowered to advocate and provide flexibility for their staff, and when they’re given adequate resources, support, and training in their roles, supervisors are less likely to look for other employment opportunities.
Higher ed employees are not receiving common retention incentives. Only 59% of employees state they receive regular verbal recognition for doing good work, and only 53% state they have received a pay increase in the past year. Other incentives, such as bonuses and stay interviews, are even less common.
Job satisfaction/well-being is the strongest predictor of retention by far. Although employees are most likely to say they’re looking for other opportunities to receive a pay increase, it turns out that receiving recognition for one’s contributions, being valued by others at work, and having a sense of belonging are far more important than fair pay in predicting whether employees will look for other job opportunities.
But other factors are also important. Increased demands and responsibilities, low pay, overwork, a lack of remote and flexible work opportunities, feeling unsafe at work, and dissatisfaction with parental benefits are all significant factors in increasing turnover and decreasing retention.
Recommendations
Higher ed leaders should recognize that the retention problem is not abating. Investment in a retention strategy should be both an immediate and ongoing priority. The data in this report provide specific directions for targeting this investment.
Attend to basic job satisfaction tenets first when prioritizing your retention resources. Employees who are looking for other opportunities don’t feel they’re being recognized for their contributions, they don’t feel valued by others at work, they don’t feel a sense of belonging, they’re not asked for their opinions, they’re not able to bring up problems or issues at work, they don’t have a good relationship with their supervisor, and they don’t feel their institution is providing them with development or advancement opportunities. Implementing programs, practices, training, and policies that address these basic job satisfaction tenets will go the furthest in improving your retention efforts.
Continue to reduce the overwork — additional hours and increased demands and responsibilities — that employees have been experiencing since the pandemic. Don’t exacerbate your retention crisis by making your current employees pay the price for your retention problem. Increasing the scope of responsibilities of current employees, insisting they absorb the responsibilities of other staff who have left, and demanding they regularly work more than full-time hours — all without corresponding and appropriate salary increases and promotions — is a recipe that will encourage your retention crisis to continue.
Provide pay increases that are regular and meaningful. The perception of fair pay is a strong predictor of retention, and the number one reason employees say they are looking for other employment is to get a pay increase. Regular, planned pay increases that outpace inflation and compete with market salaries are needed to provide employees with an incentive to stay.
Although higher ed in general provided record salary increases last year, these increases did not keep pace with inflation.[42] In fact, higher ed employee salary increases have not kept pace with inflation since the pandemic started, meaning that employees have essentially been receiving pay decreases for the past few years. In addition, only half of employees state they received a pay increase in the past year. It is no wonder, then, that employees are looking for other job opportunities to get an increase in pay.
Provide more flexible work arrangements. This is low-hanging fruit that many higher ed leaders are ignoring. Remember the two-thirds rule: two-thirds of employees believe that most of their duties can be performed remotely, two-thirds of employees would prefer to have remote or hybrid work arrangements, and two-thirds of employees are being forced to work strictly on-campus. Small changes can move the needle. Allowing one day of working from home per week, implementing half-day Fridays, reducing summer hours, and allowing employees some say in their schedules are all examples of flexible work arrangements that will improve employee satisfaction.
Recognize that retention is a particular problem with employees who are younger than 45, and specific resources may need to be targeted to that group. The provision of remote and flexible work opportunities should be tools in your arsenal to compete with the other organizations looking to appropriate your talent.
Ensure employee safety and their confidence that leadership will act ethically and responsibly. Only three out of four employees say they feel safe from violence, crime, and health infections on campus. In addition, only half say their leadership will act ethically and responsibly in times of crisis. Review the policies you have in place to address crisis situations on your campus, strengthen these policies where there are gaps, and ensure these policies are regularly communicated to staff.
Improve your institution’s parental benefits. Fewer than half of employees are satisfied with their institution’s parental leave policy or childcare benefits. Virtually no employees stated they received any type of improvements to child or elder care benefits in the past year. Making improvements to these benefits will target those employees at most risk for leaving — those under the age of 45.
Support your supervisors in providing all of the above. Supervisors are bearing the brunt of the retention crisis. They are more likely to work additional hours and take on additional responsibilities. In addition, they are challenged with filling empty positions and maintaining staff morale. Ensuring supervisors have a) the power they need to advocate for their staff, b) the power to provide more flexible schedules and work arrangements, and c) adequate resources, support, and training will go a long way to addressing the all-important factor underlying staff (and supervisor) retention — basic job satisfaction.
About the Authors:
Jacqueline Bichsel, Ph.D., is director of research at CUPA-HR.
Melissa Fuesting, Ph.D., is a senior survey researcher at CUPA-HR.
Diana Tubbs, Ph.D., is a survey researcher at CUPA-HR.
Jennifer Schneider, Ph.D., is a survey researcher at CUPA-HR.
Graphics were created by Kate Roesch, data visualization developer at CUPA-HR.
Citation for This Report:
Bichsel, Jacqueline; Fuesting, Melissa; Tubbs, Diana; & Schneider, Jennifer. (2023, September). The CUPA-HR 2023 Higher Education Employee Retention Survey. CUPA-HR. https://www.cupahr.org/resource/higher-ed-employee-retention-survey-findings-september-2023/
Read our full research disclaimer and terms of use.
The data collection period for the 2023 survey was April 10 to April 23, 2023. The pilot survey was conducted in May 2022.
Bichsel, J., Fuesting, M., Schneider, J., & Tubbs, D. (2022, July). The CUPA-HR 2022 Employee Retention Survey: Initial Results. CUPA-HR.
CUPA-HR. (2023). CUPA-HR 2022-23 Higher Education Workforce Surveys [Data set].
Notice of and distribution of the survey was provided through an online site. The survey was taken entirely online through Alchemer. We thank the CUPA-HR members and other professional organizations that distributed the survey link, as well as the thousands of higher ed employees who took the time to complete the survey.
A total of 4,876 people completed the survey, but 94 were excluded for one or more of the following reasons: they did not list a college or university when asked to provide the name of their employer or they indicated in a free response that they were faculty or instructors.
Figure 1 shows data for those who answered questions asking for self-identification of gender (96% of respondents) and race/ethnicity (97% of respondents). A nonbinary category was included in the gender item of the survey, but the number of nonbinary employees (n = 68) could not be meaningfully depicted in this intersectional graphic.
CUPA-HR. (2023). 2022-23 Administrators and Professionals in Higher Education Surveys [Data set].
Departments/areas with n < 100 (representing 2% or less of survey respondents) were not included in comparative analyses of departments/areas in this report. These include Athletics, Grants and Research Operations/Programs, Housing/Residential Services, and Food Service/Dining. Data from employees in these areas were still included in other analyses that did not compare departments/areas.
Special focus/other institutions include medical/law institutions, tribal colleges, international institutions, for-profit institutions, and unclassified institutions.
Bichsel et al., 2022.
t(4,242) = 13.32, p < .001. To aid in interpreting the statistics throughout this report, M denotes the mean, SD denotes standard deviation, and t denotes the statistical test used to determine whether two means are significantly different from one another.
Ibid.
t(1,808) = 3.92, p < .001
t(2,592) = 9.80, p < .001. Employees of color include those self-identifying as Asian, Black, Hawaiian or Pacific Islander, Hispanic or Latina/o, Native American or Alaskan Native, and those of multiple races.
Respondents who reported they were either very likely, likely, or somewhat likely to look for new work opportunities in the next year were asked to complete this question (n = 2,682). Response options allowed participants to select all that applied.
Respondents reporting they were either very likely, likely, or somewhat likely to look for new work opportunities in the next year were asked to complete this question about the reasons they were seeking new employment opportunities (n = 2,682). Survey respondents were asked to rank the top 3 main reasons, from 9 options, that would impact their decision to look for other employment.
Analyses of this data found no notable differences in reasons provided by department.
Parker, K., & Horowitz, J. M. (2022). Majority of Workers Who Quit a Job in 2021 Cite Low Pay, No Opportunities for Advancement, Feeling Disrespected. Pew Research Center.
Howe, D. C., Chauhan, R. S., Soderberg, A. T., & Buckley, M. R. (2021). Paradigm Shifts Caused by the COVID-19 Pandemic. Organizational Dynamics, 50(4). doi: 10.1016/j.orgdyn.2020.100804
Aksoy, C. G., et al. (2023). Working From Home Around the Globe: 2023 Report. WFH Research.
The survey included a series of questions about remote work preferences and actual work arrangements. First, respondents were asked to assess whether their job duties could be predominantly conducted remotely, with response options ranging from “strongly agree” to “strongly disagree.” Second, employees were asked about their current work arrangement, with possible responses including: “completely on-site,” “mostly on-site,” “partially on-site and partially remote,” “mostly remote,” and “completely remote.” Finally, the survey inquired about the respondents’ ideal work arrangement, providing them with the same response options as the current work arrangement question.
Bichsel et al., 2022.
Barrero, J. M., Bloom, N., & Davis, S. J. (2021). Why Working From Home Will Stick (NBER Working Paper No. 28731). National Bureau of Economic Research, Inc.
Bichsel et al., 2022.
Fuesting, M. & Schneider, J. (2023). The CUPA-HR 2022 Higher Education Employee Retention Survey: Focus on Supervisors. CUPA-HR.
Ibid.
The analysis in Table 2 regressed supervisors’ likelihood of looking for other employment onto whether they agree they have adequate management training, resources and support in their supervisory role, power to advocate for their staff, power to allow flexible schedules for their staff, and power to allow their staff to work remotely. The overall model was significant, F(5, 1,646) = 73.82, p < .001, adjusted R2 = .18.
Fuesting & Schneider, 2023. We consider the prediction model more accurate in the current report given that we have a more representative sample of the higher ed workforce in our 2023 data.
Employees were asked to rate their agreement with 22 statements related to their work and institutional environment. Questions used a five-point Likert scale of agreement (Strongly Disagree, Disagree, Neither Agree nor Disagree, Agree, Strongly Agree).
Bichsel et al., 2022.
There was no significant difference in agreement between men and women on this item.
Bichsel et al., 2022.
Based on a comparison of mean disagreement scores on this item. Employees of color (M = 4.00, SD = 1.01) were more likely to disagree they feel safe from violence/crime than were White employees (M = 3.81, SD = .96), t(4,524) = 2.85, p = .004. Women (M = 3.92, SD = .99) were more likely to feel unsafe from violence/crime than were men (M = 4.02, SD = 1.02), t(2,418) = 5.63, p < .001.
An example of this variance by department is demonstrated by the differences in agreement to career opportunities. Nearly half of human resources employees (44%) agree that opportunities for advancement exist and more than half (52%) believe that the institution is genuinely invested in fostering their career growth. In contrast, only 17% of librarians express agreement about opportunities for advancement, and just 28% believe their institution is invested in their career.
Employees of color did not have significantly lower agreement than White employees for three satisfaction items: institutional investment in career development, opportunities for advancement, and clarity on priorities.
Employees of color had significantly lower agreement that they felt safe from infections/health problems at work (M = 3.76, SD = 1.09) and lower agreement that they had the ability to bring up problems and tough issues at work (M = 3.47, SD = 1.12) compared to White employees ((M = 4.00, SD = .93), t(2,342) = 7.24, p < .001) and (M = 3.66, SD = 1.05), t(2,498) = 5.32, p < .001)).
Besides safety at work and bringing up problems at work, the only other item that differed by gender was that women had higher agreement (M = 3.70, SD = .93) compared to men (M = 3.57, SD = 1.02) that their institution’s mission, policies, and practices reflect their personal values, t(1,731) = 3.73, p < .001.
Questions used a five-point Likert scale of satisfaction (Very Unsatisfied, Unsatisfied, Neither Unsatisfied nor Satisfied, Satisfied, Very Satisfied).
Analysis excludes those who skipped this question altogether, leaving an n of 3,972.
Principal components analysis using SPSS with Varimax rotation.
An initial analysis revealed that both age and perception of fair pay did not “hang” well with any of the factors and should be considered individually in predictions of retention. In addition, years in position and number of direct reports were not included because of their high correlations with age and low correlations with the likelihood of looking for other employment.
CUPA-HR. (2023). CUPA-HR Annual Workforce Data: Annual Pay Increases by Position Type. [Interactive graphic].