
The Higher Ed HR Workforce
This report was made possible with the support of
![]()
By Adam Pritchard and Anthony Schmidt | August 2020
Introduction
People are integral to an institution’s mission. The strategic management of human resources is the foundation on which organizational success is built and maintained. Every organization seeks to attract and retain the talent necessary to fulfill its mission, considering both the needs of today and looking into the future. Higher education is no exception, and higher education human resources plays a central strategic role in shaping the organizational environment of their institution.
In higher education, human resources might be responsible for recruitment, training, employee relations, payroll, benefits, job classification, institutional effectiveness, diversity and inclusion efforts, and EEOC/AA or Title IX compliance, to name only a few roles. Higher education HR works to recruit and retain top talent, develop the skills and talents of employees, and foster an inclusive environment on campus. The work of HR also involves developing comprehensive people strategies that drive operational excellence throughout an institution and throughout the employee life cycle, from onboarding to retirement.
In this report, we examine the people and positions that make up the higher education human resources workforce.
The human resources positions examined here come from 31 positions surveyed across CUPA-HR’s Administrators, Staff, and Professionals in Higher Education surveys.1Learn more about the CUPA-HR Administrators in Higher Education, Staff in Higher Education, and Professionals in Higher Education surveys. This report begins by describing the demographic characteristics of the higher education HR workforce in terms of race/ethnicity, sex, age, and time serving in their current role. Next, it details HR staffing ratios relative to other higher ed employees and provides an overview of specialization areas within higher education HR. This report also examines how specialization in different areas within HR impacts salary and career trajectories. Finally, we spotlight the chief human resources officer position to examine how representation, compensation, and the reporting relationship of this key HR position varies among higher ed institutions.
For the purposes of this research report, 31 positions have been classified as the most common human resources positions. In all, 11,810 incumbents from 1,145 institutions were included in this analysis. These positions, organized by both position level and functional area, include the following:
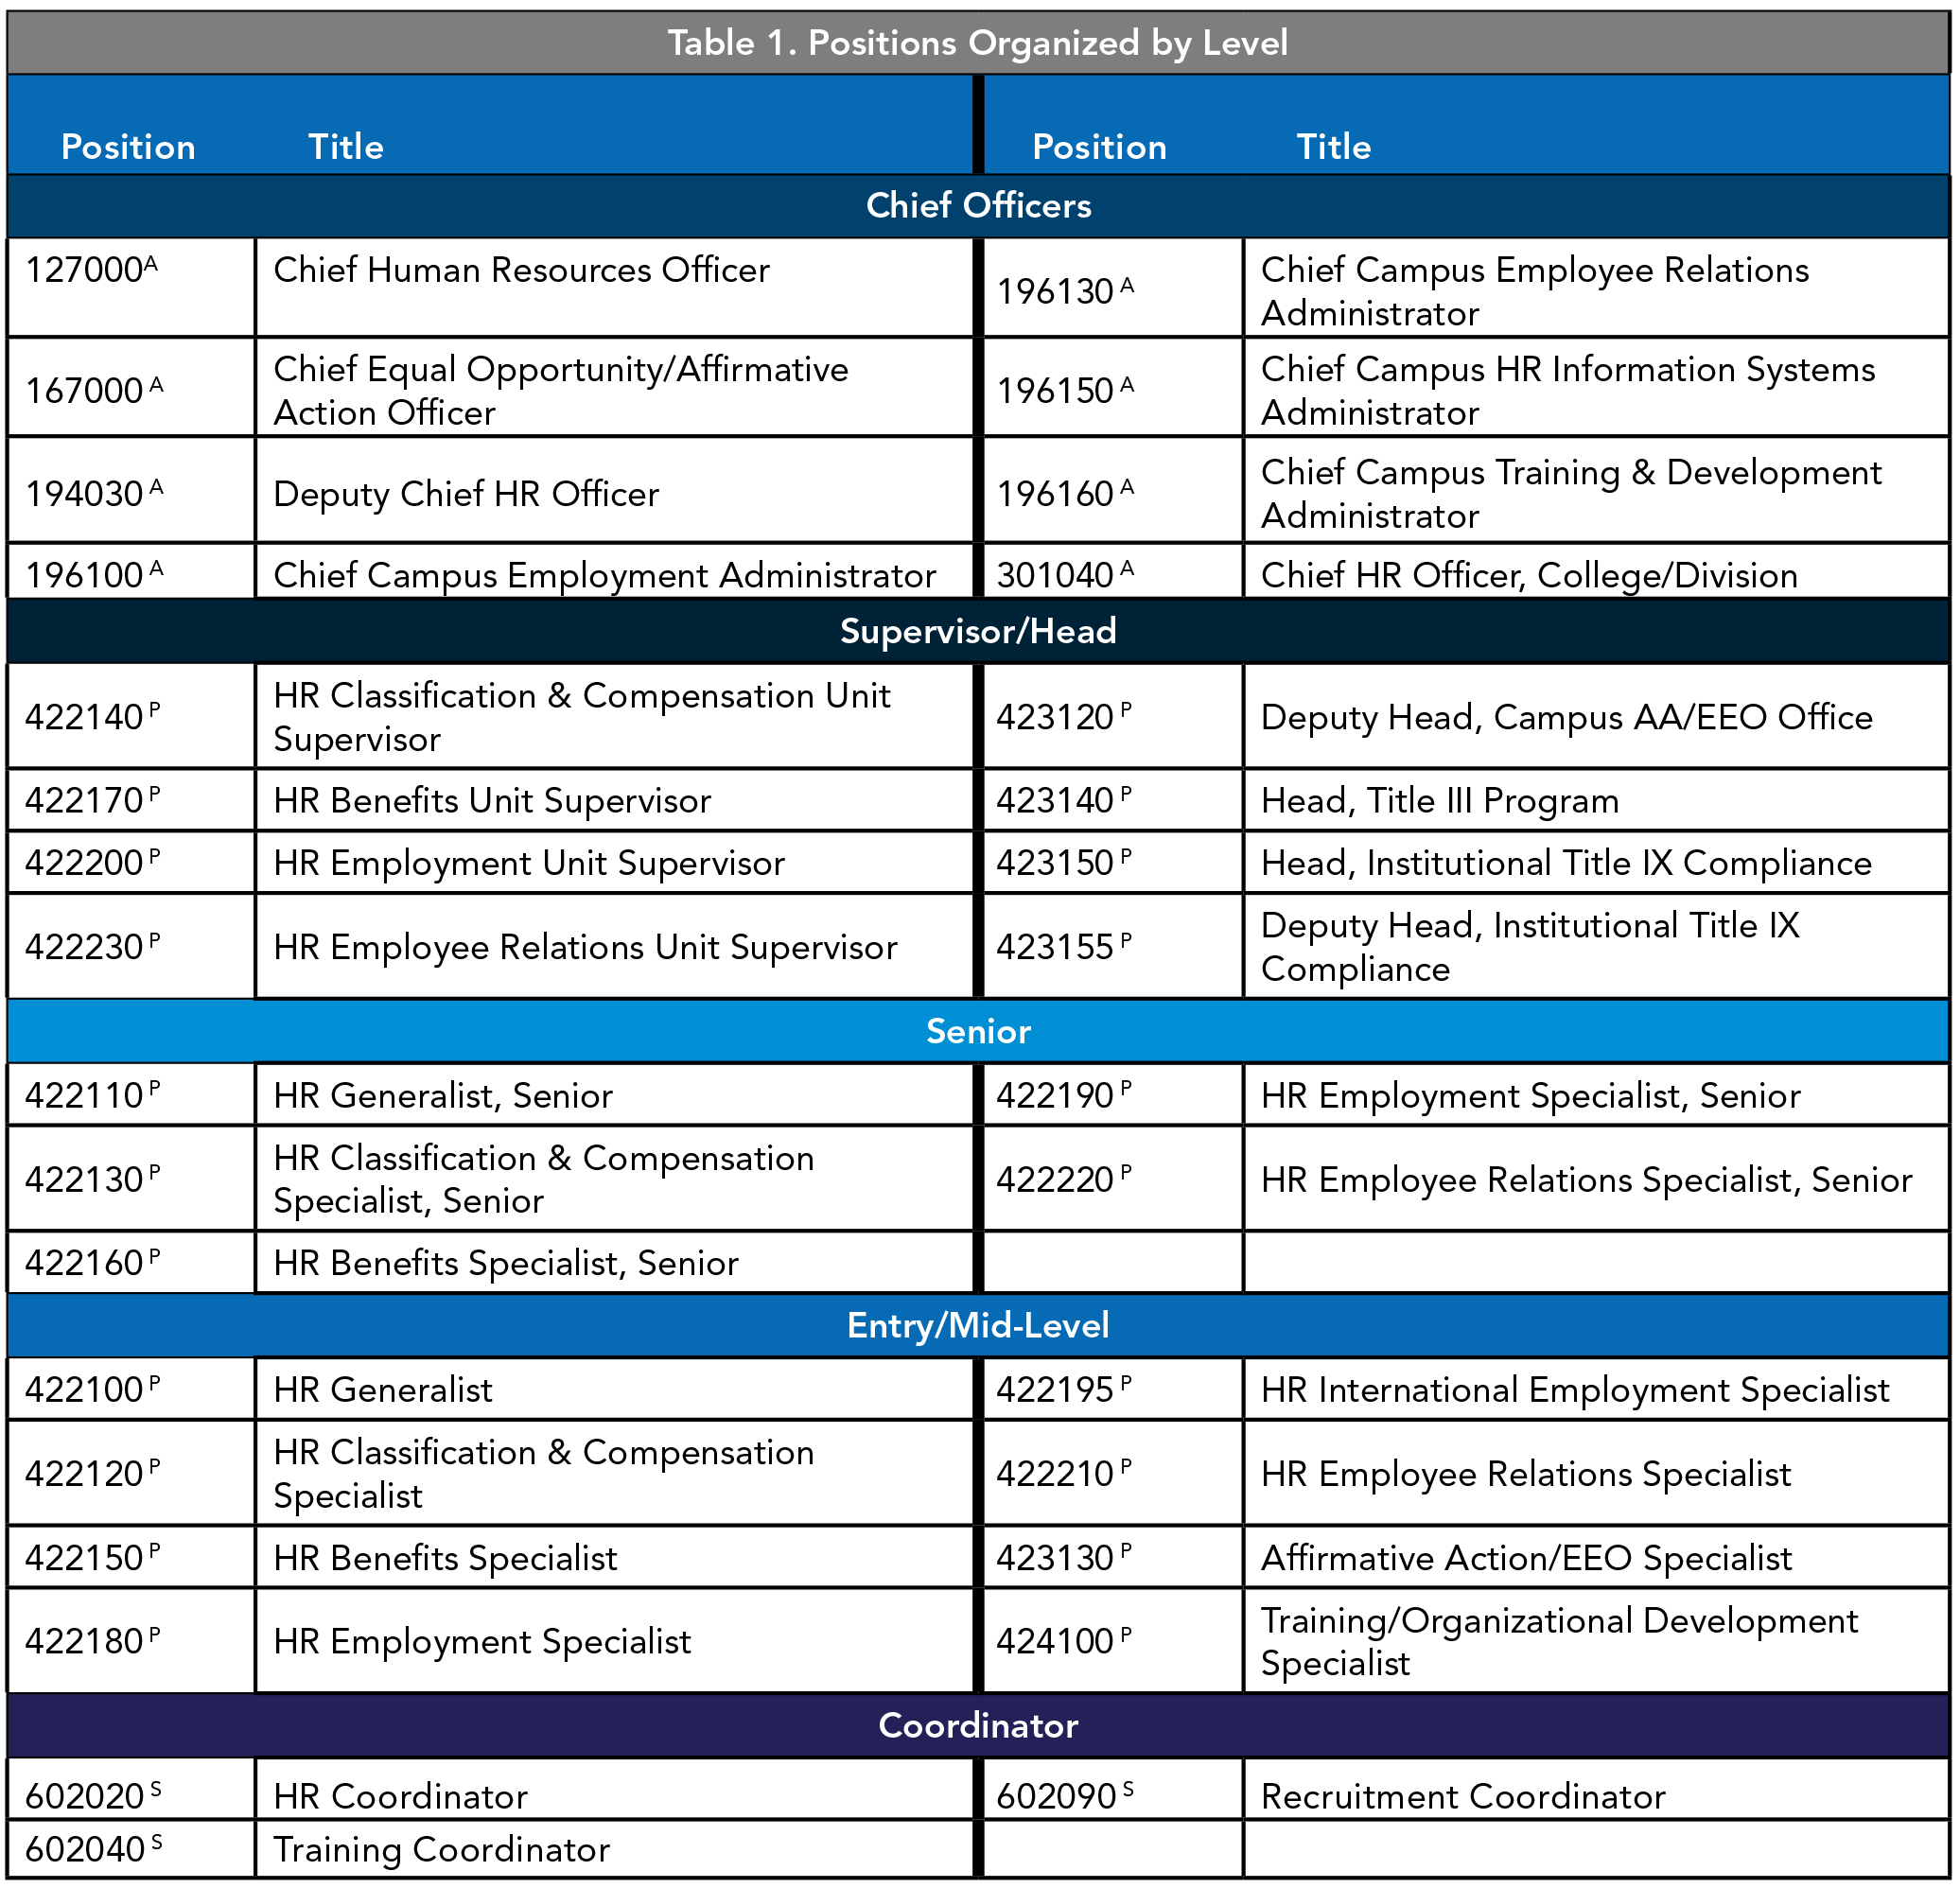
(A) Administrators in Higher Education Survey. (P) Professionals in Higher Education Survey. (S) Staff in Higher Education Survey. Full position descriptions are available in the Survey Participation and Information Templates for the applicable survey on the CUPA-HR website.
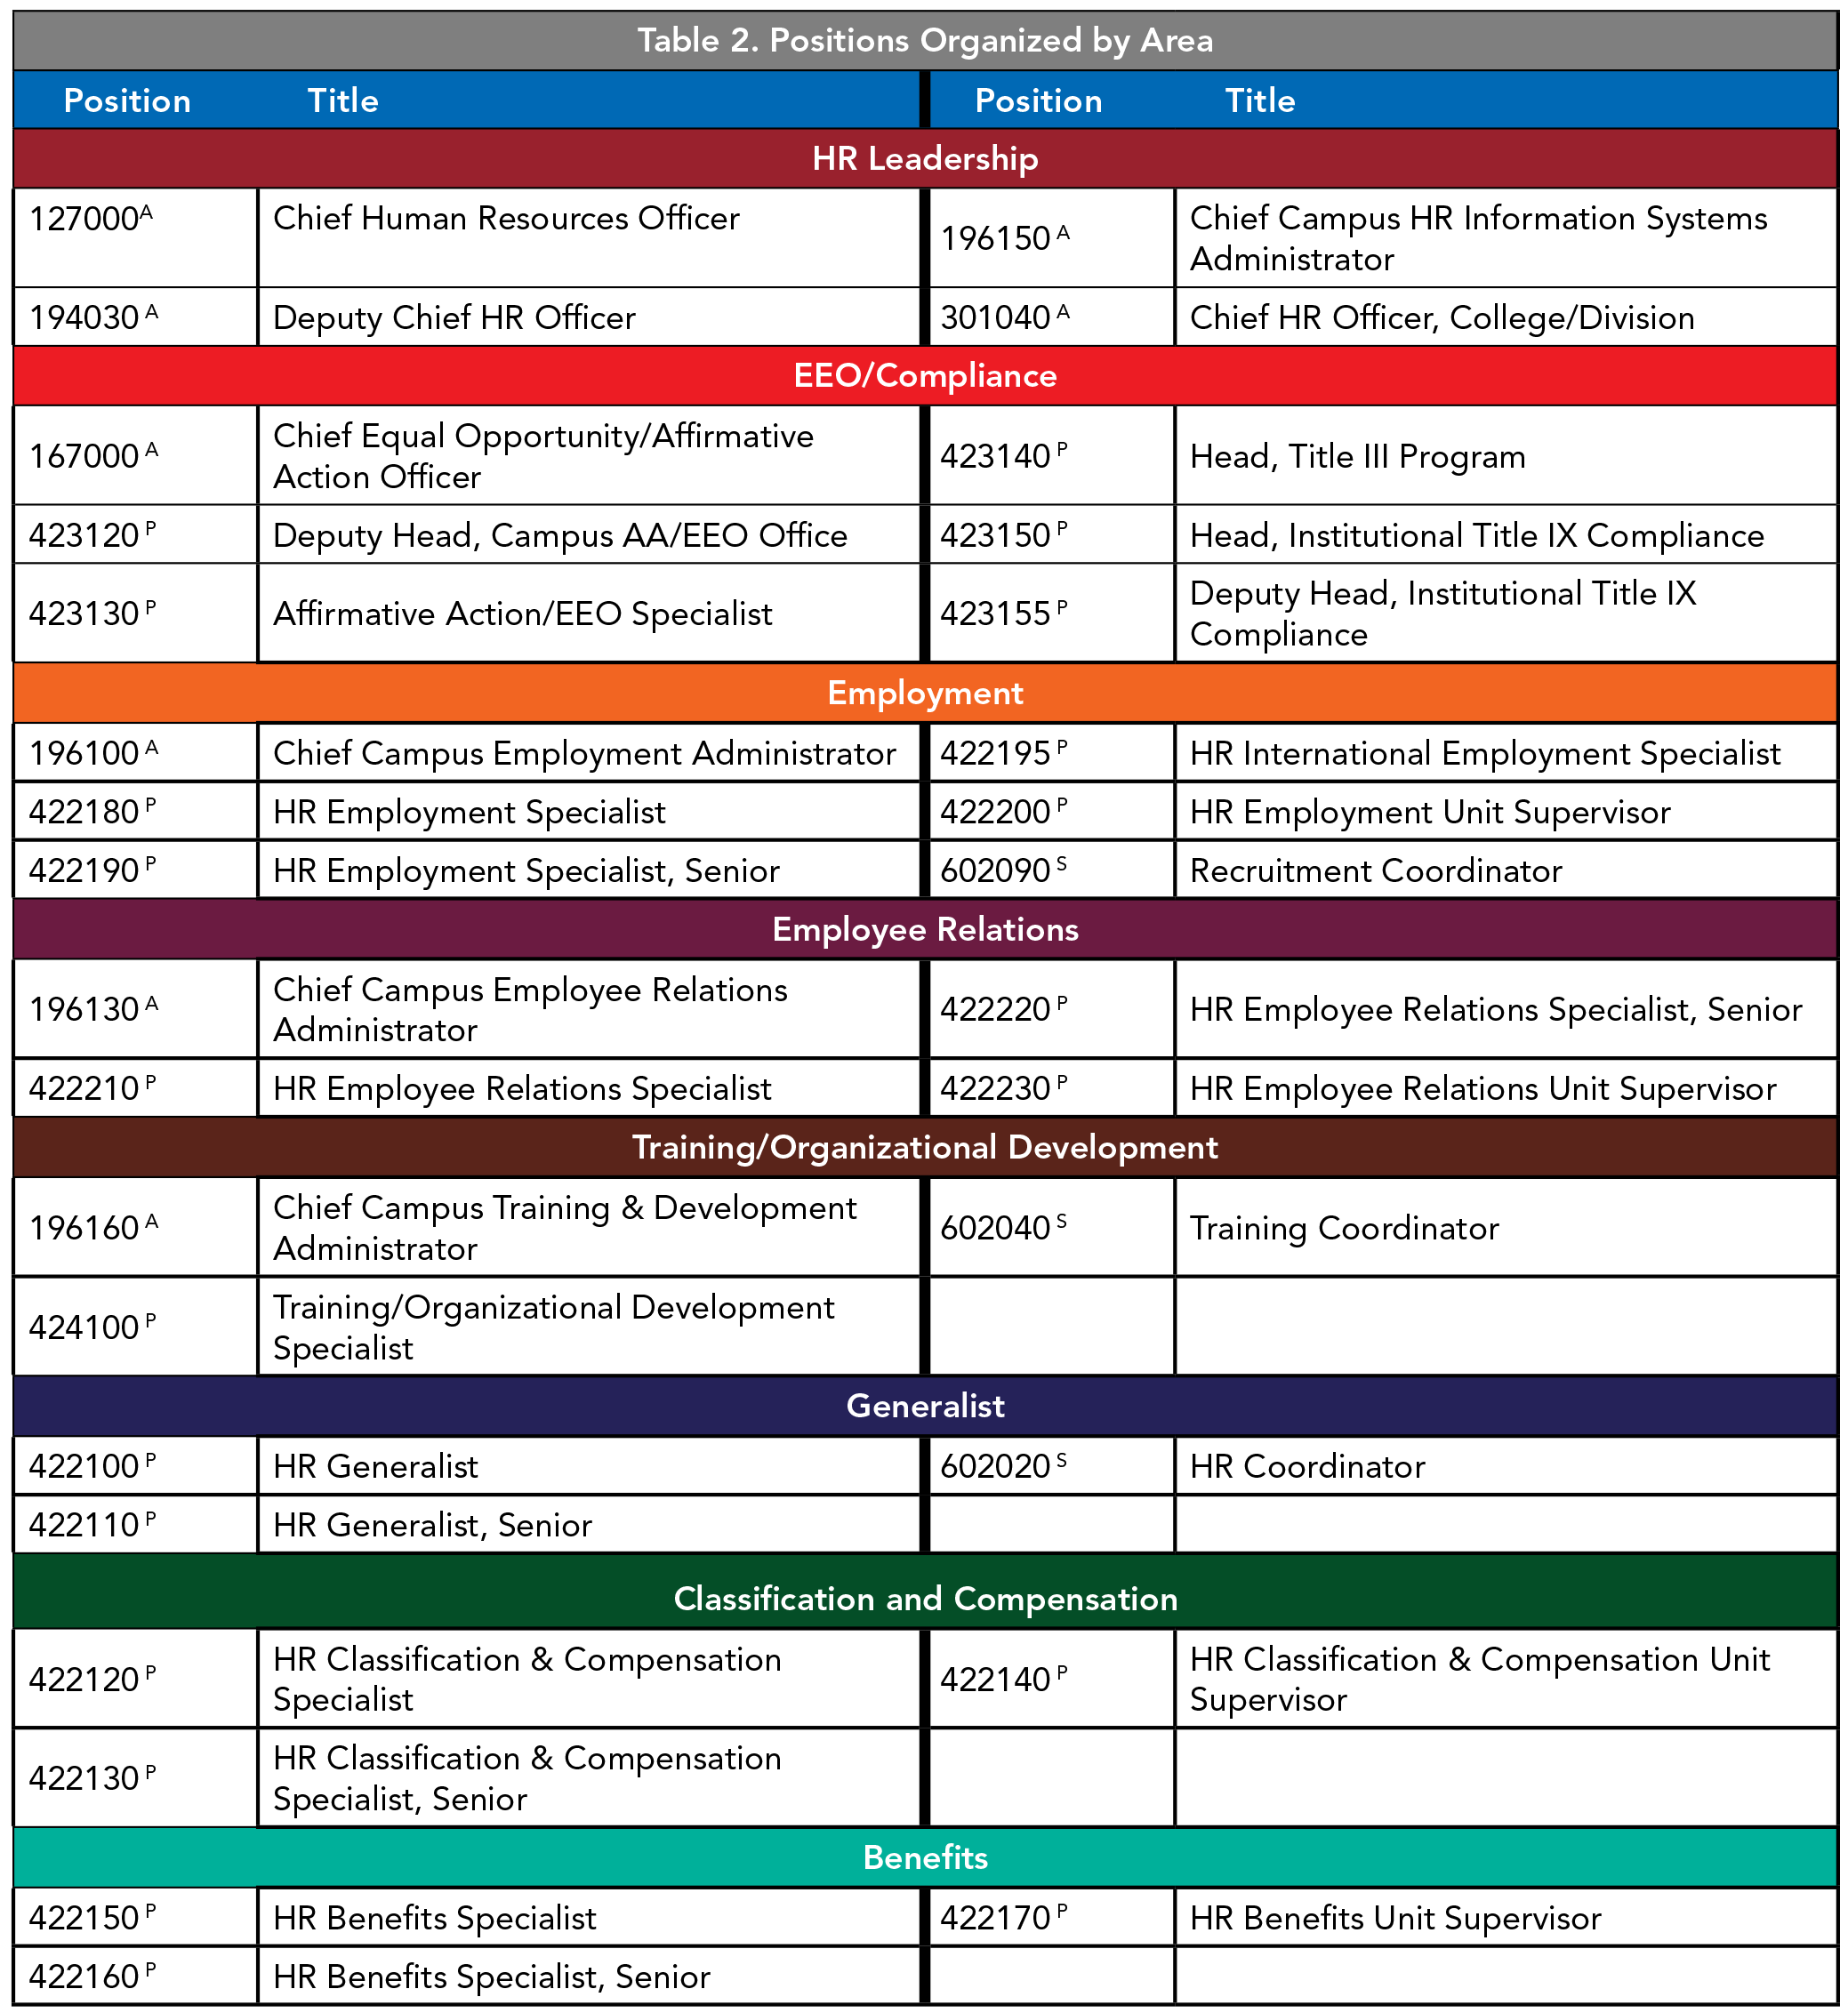
(A) Administrators in Higher Education Survey. (P) Professionals in Higher Education Survey. (S) Staff in Higher Education Survey. Full position descriptions are available in the Survey Participation and Information Templates for the applicable survey on the CUPA-HR website.
Characteristics of the HR Workforce
Data collected on individual employees allows an analysis of not only the positions in higher education HR, but also the characteristics of the individuals who serve in these roles. This section highlights some key characteristics of higher education HR employees.
Race/Ethnicity and Sex
Figure 1 shows the composition of higher ed HR staff by race/ethnicity and sex. In higher education HR, 27% of the workforce are racial/ethnic minorities, and 82% are women. White women make up 59% of all HR employees, and minority women make up 23% of all HR employees, the second largest group. Men make up only 18% of all HR positions, and three-fourths of these men are White. The least represented groups in higher education HR are Asian and Hispanic men, together accounting for only 2% of all HR employees. Figure 1 also shows that there is slightly lower representation of both women and minorities in leadership positions (chief, head, or supervisor) than in other HR positions.

Figure 1. HR Staff Representation by Ethnicity and Sex
Age and Time in Position
The median age of all HR employees is 47 years old, and some have many years in their position. For each position level within the HR workforce, Figure 2 shows the median age and median time in current position. Even in coordinator positions, the youngest and lowest-level positions, the median age is 42 years old.
The scatterplots in Figure 2 help to illustrate the relationship between age and years in position. The clustering to the left-hand side shows a high number of employees with zero to five years in their positions, and the spread from bottom to top indicates a great variability in age for most employees across all HR position levels. For HR leadership positions, the median years in position is the furthest to the right, indicating that more HR leaders remain in the same position at an institution for a longer time period than employees at other levels.
Figure 2 represents age and years in position for both women (green dot) and men (purple dot). These scatterplots are mostly green in color, reflecting the fact that there are far more women in human resources than there are men. The way these colors are distributed within each scatterplot generally shows a similar distribution of women and men by age and years in position; however, there are a few notable exceptions. First, in the graph of the coordinator level, there are no men with more than 15 years in the same position — all employees with extended service at this lowest level are women. In fact, there is a large gap among coordinators between the median age of men (34 years old) and women (44 years old), and women serve a longer median time in the same coordinator position (three years, compared to two years for men). Second, for non-leadership professional positions (i.e., entry/mid-level and senior), the median age for men is lower than for women. This suggests that men enter and advance in these HR positions at a younger age than women (about three years earlier), even though men make up less than one in five HR professionals.
It is also notable in Figure 2 that the density of men is higher at upper levels (e.g., chief) than at lower levels (e.g., coordinator). Men make up a slightly higher percentage of employees at each step up in position level. Men make up about 15% of coordinators, 16% of entry/mid-level and senior positions, 18% of heads/supervisors, and 23% of HR leadership positions. The converse is true for women, who make up a decreasing percentage of the HR workforce at each step up in position level.

Figure 2. Relationship Between Age and Years in Position by Sex
Staffing Ratios and Areas of Specialization
Human resources works to create opportunities for higher education’s faculty, staff, and students to be successful, therefore it is important for an institution to benchmark the workload and capabilities of its HR organization relative to the size of these campus constituencies.
Staffing Ratios by Institution Size
Figure 3 shows the median ratios of HR staff to faculty, all staff, and students across the range of institution sizes. Percentiles in 10 percent increments, called deciles, are used to show how this ratio changes as student, faculty, and staff sizes increase. The median, or 50th percentile, is the point at which exactly half of the institutions’ FTE (full-time equivalent) counts are below and half are above for each group indicated on the graphic. Individuals considered by their institution to be part of the HR function comprise between 1.4% and 2.1% of all staff.
The ratios in Figure 3 generally show a trend of decreasing HR staff per 100 employees (faculty + staff) as institution size increases. The combined faculty/staff FTE ratio (purple line) shows that the smallest institutions (10th percentile) have a median of 1.22 HR staff per 100 employees, whereas the largest institutions (90th percentile) have a ratio of only 0.92. In other words, there are slightly fewer HR staff per 100 employees at larger institutions than smaller ones.
This overall pattern, however, does not tell the whole story. There are important differences in the ratios of HR staff to all staff versus HR staff to faculty. The ratio of HR staff to all staff (red line) decreases steadily as size increases, whereas the ratio of HR staff to faculty (yellow line) decreases up to the median size, then begins to increase again for larger institutions. These differences reflect the fact that larger institutions have different workforce compositions than smaller institutions. At the largest institutions (90th percentile) these ratios diverge the most, likely related to the changing ratio of faculty to all staff at these very large institutions. Put simply, the number of staff at very large institutions is proportionately larger than at smaller institutions, whereas the number of faculty grows less rapidly.

Figure 3. Ratios of HR Staff to Faculty, Staff, and Students Compared to Institution Size
Areas of Specialization
Individual-level data for each position collected by CUPA-HR surveys makes it possible to categorize HR positions into several functional areas (see Table 2). Examining the relationship between the number of employees served by HR and the staffing in each specialization can provide insights into the relationship between the need for specialists and institution size.
Figure 4 shows the relationship between the median number of HR staff in each specialization area and the number of combined faculty/staff (based on FTE) at their institution.2Full-time equivalent (FTE) of 1.0 per employee is used to estimate total number of employees for each institution. A full-time employee is counted as 1.0 FTE per employee, while part-time employees count as 1.0 FTE for every three employees. The lines for each area of specialization tell us the size at which institutions begin to add additional employees in each of these areas. For example, the median number of generalists rapidly increases as total FTE goes up, surpassing two at around 900 total employees, and reaching four at around 2,100 employees. For EEO/compliance specialists, the median does not reach two until beyond 2,700 employees. Employment specialists become more common with rising employee counts up to 1,200, then level off before increasing again when the number of employees reaches 2,400. These trends provide clues as to how institutions think strategically about adding specialized HR positions depending on their workforce size.
One clear pattern in these data is that the median number of HR specialists for all areas except generalist rarely exceeds more than two or three staff across the range of institutional sizes until the number of total employees is extremely large. The need for additional generalists increases much more with workforce size than for other positions. In addition, some specialists are added at much smaller workforce sizes (e.g., benefits, EEO/compliance), and others do not increase until workforce sizes are larger (e.g., employee relations, classification and compensation).
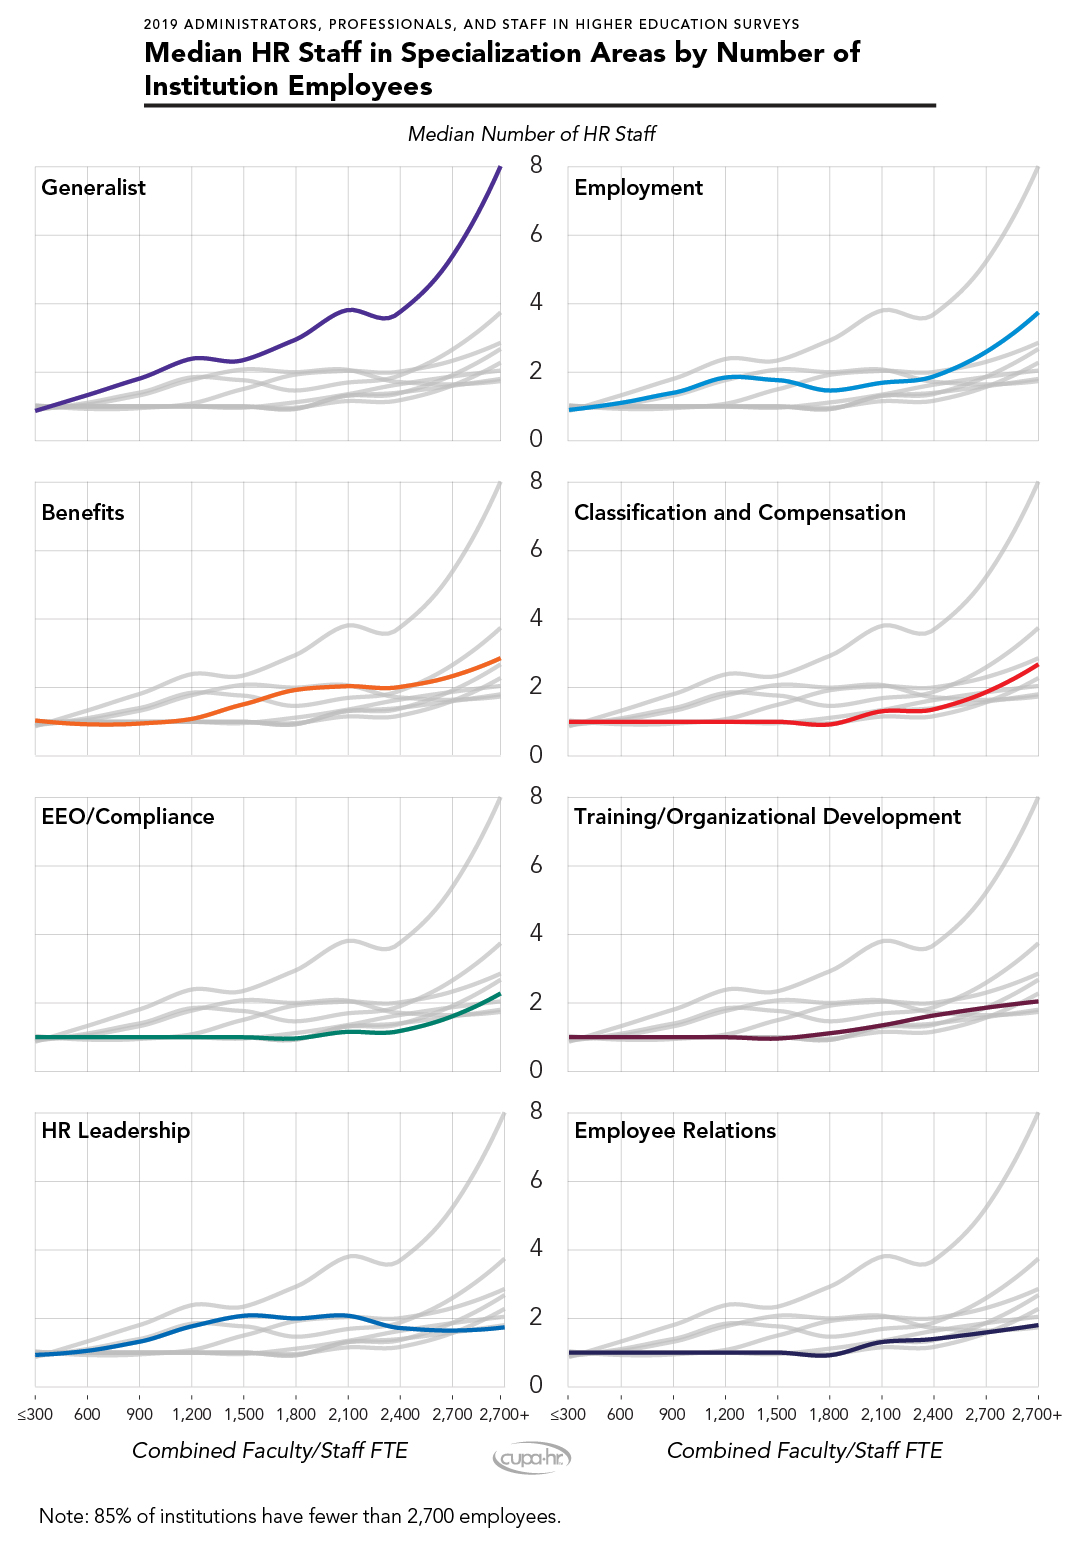
Figure 4. Median HR Staff in Specialization Areas by Number of Institution Employees
Another way of looking at HR specializations is to consider the composition of higher education HR overall. The proportion of all HR employees specializing in each area is represented in Figure 5. Most HR employees in higher education are classified as generalists (36%). Around 15% of the HR workforce are HR leadership, 13% are employment specialists, 10% are training/organizational development specialists, and 10% are benefits specialists. Classification and compensation specialists are the smallest area, comprising 4% of the higher education HR workforce.
More than half (51%) of the HR workforce is comprised of generalists and HR leadership positions. Figure 5 shows that HR leadership positions are the second-largest group. This suggests that most institutions have low numbers of specialist HR positions — most commonly employment, training/organizational development, and benefits specialists. Other specialization areas (EEO/compliance, employee relations, classification and compensation) are reported at less than 1 position per institution on average.3Most of the positions in specialization areas are found in the Professionals in Higher Education Survey, for which 888 institutions reported at least one HR position. It is possible that many smaller institutions roll these functions into generalist positions or delegate at least some of these duties to another division (e.g., payroll, legal).

Figure 5. Percentage and Number of HR Staff in Each Specialization Area
Turnover Rates
In terms of turnover — another key metric for a workforce area — HR compares very favorably to the rest of higher education. Figure 6 compares the turnover rate for HR to that of faculty and staff. The turnover rate for HR employees (7.7%) is more comparable to faculty (8.3%) than other higher education staff (14.2%). This is remarkable given that a large part of the faculty workforce is tenured, and HR employees lack this important factor in faculty longevity. The data strongly suggest that employment in higher education HR is very stable relative to the rest of higher education.
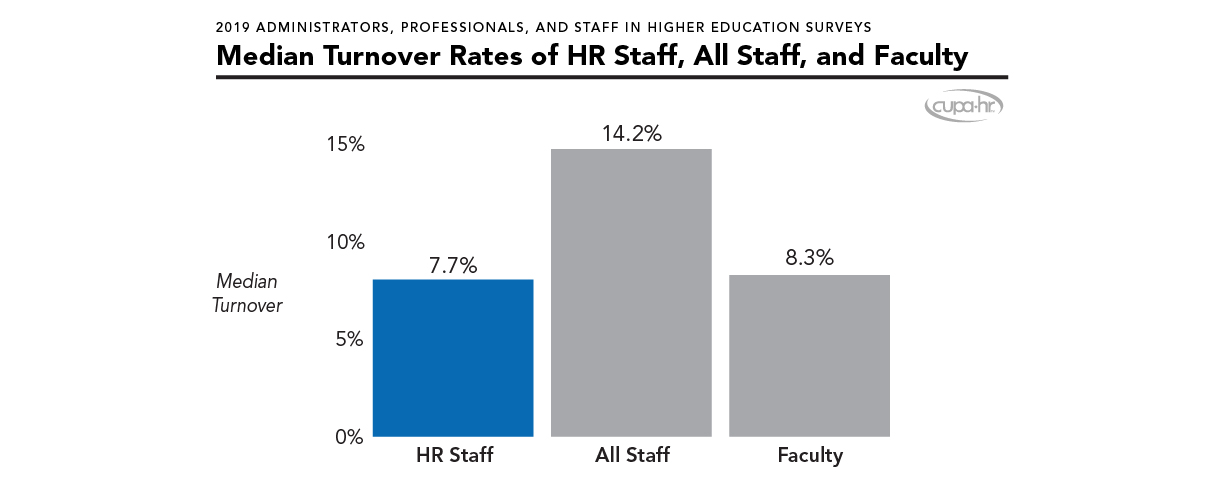
Figure 6. Median Turnover Rates of HR Staff, All Staff, and Faculty
Salary by Area and Position Level
Within higher ed HR, each area has unique salary and career advancement opportunities, whether that’s a specific promotion pathway or simply a larger number of total positions within a specialty area. Figure 7 explores career pathways and median salaries through each position level within these areas.4The CHRO position is not included in this model, as no area of specialization is uniquely linked to this role. Not all areas are present at each institution, so some areas may have more or fewer incumbents overall as a result. These pathways represent levels within specialties, but individuals are not necessarily advancing directly on these paths (e.g., a senior generalist may advance to become head of employee relations). The circle size represents the relative number of available positions. For instance, there are far more head/supervisor positions within EEO/compliance than within classification and compensation, and there are more generalists than any other specialization. For the details on which positions are included within each area and position level, refer to Tables 1 and 2 at the beginning of this report.
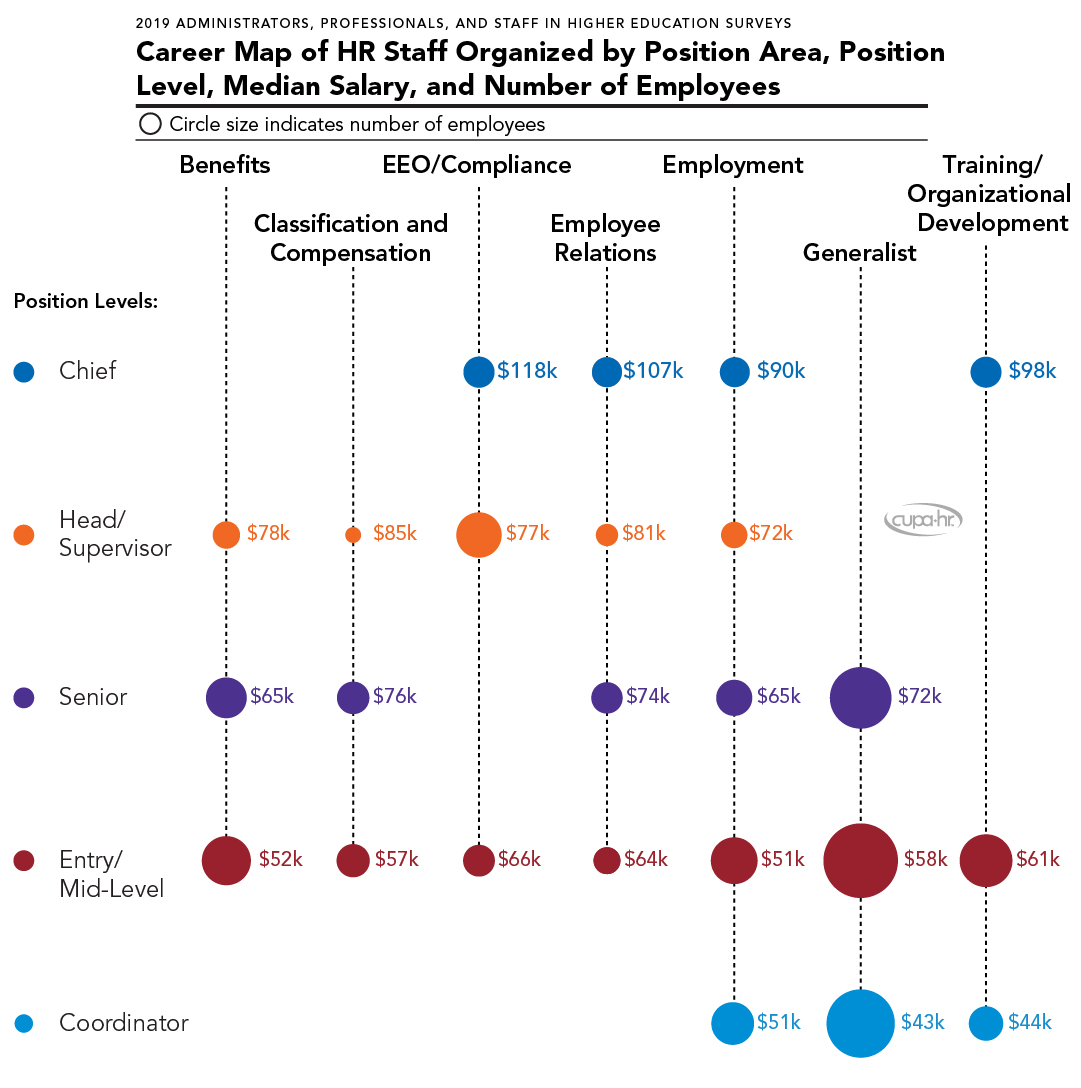
Figure 7. Career Map of HR Staff Organized by Position Area, Position Level, Median Salary, and Number of Employees
Up Close: The CHRO
The chief human resources officer (CHRO) is the highest-ranking HR officer at an institution of higher education. Now, more than ever, CHROs are becoming the go-to leaders when organizations need to communicate with their workforce.5Huffington, A. (2020, June 3). How CHROs Have Met the Moment. Harvard Business Review. The CHRO strategically develops and manages organizational culture, with responsibility for HR policies, procedures, and operations of functional areas. Within CUPA-HR surveys, this position has the following position description: “A CHRO is responsible for administering institutional human resource policies and practices for staff and/or faculty. Overall responsibilities typically include personnel records, benefits, staff employment, wage and salary administration, and (where applicable) labor relations.”
The CHRO is also often a role model and key advocate for promoting diversity, equity, and inclusion on their campus, so it is pertinent to examine the demographics and compensation patterns within the CHRO position itself with respect to diversity and pay equity.6See the description of this and other positions in the Survey Participation and Information Templates. Both sex and race/ethnicity were reported for 809 CHROs in the CUPA-HR 2018-19 Administrators in Higher Education Survey.
Representation, Compensation, and Pay Equity for Women
Like the HR workforce overall, most CHROs are women (74%). Although women make up the majority of CHROs, the median pay for women is only $0.96 for every dollar paid to men (around $4,600 less per year at the median salary). Figure 8 shows the pay ratio of women to men and representation in the CHRO position over the past two decades. Although institutions overall still pay women less than they pay men, much progress has been made in closing this gap since the 2000-01 academic year, when women CHROs were paid only $0.83 for every dollar paid to men (around $12,700 less per year at the median salary, equivalent to around $16,900 in today’s dollars). Over this same time period, women’s representation in this top HR leadership position increased from 61% to 74%.
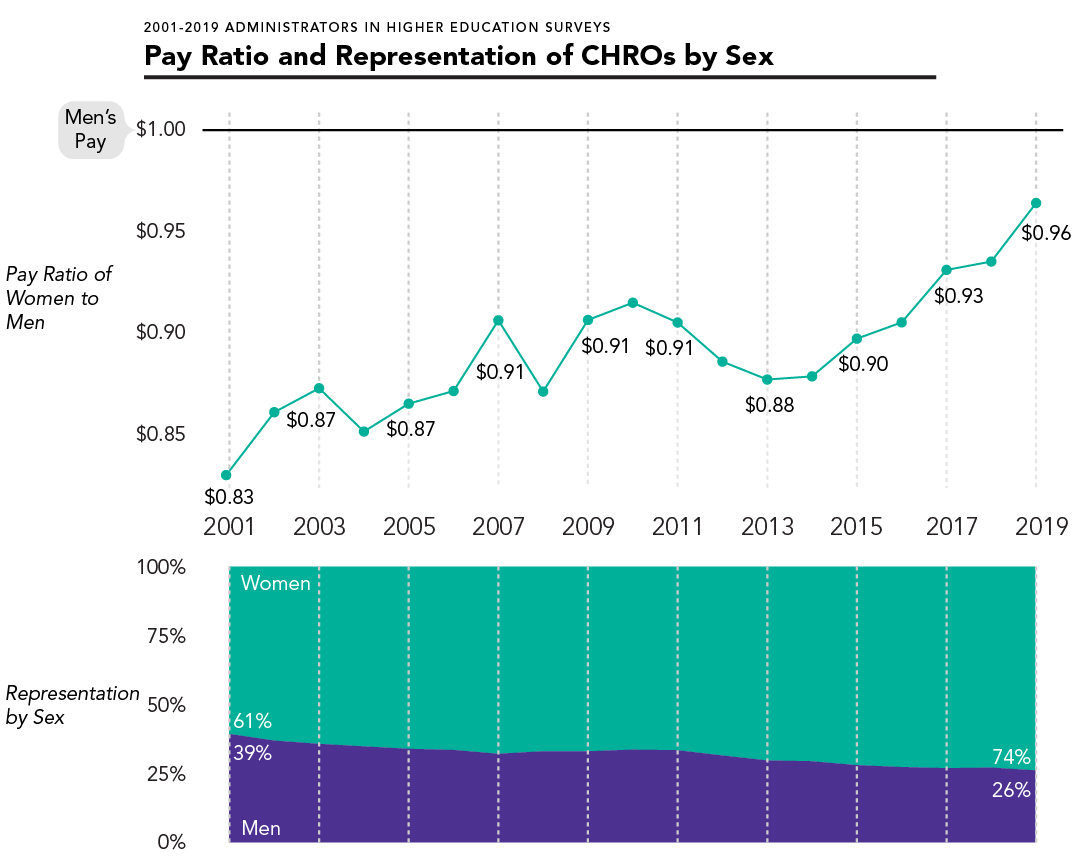
Figure 8. Pay Ratio and Representation of CHROs by Sex
Representation, Compensation, and Pay Equity for Racial/Ethnic Minorities
Figure 9 charts the pay ratio and representation of CHROs by race/ethnicity since 2011-12.7Academic year 2011-12 is the first year for which race/ethnicity is available for CHROs in CUPA-HR survey data. Only one in five CHROs is a racial/ethnic minority (20%) compared to 27% of the HR workforce overall (see Figure 1). Asians make up only 1% of CHROs, whereas 17% of CHROs are Black or Hispanic.
In terms of median pay, racial and ethnic minorities are paid much higher median salaries than their White counterparts. The median pay ratio of salaries for minority CHROs relative to White CHROs is $1.21 per dollar, which has increased about 6% (or $0.07 per dollar) over the past eight years. This pay premium likely reflects institutions’ efforts to recruit and retain minority administrators. Representation data (Figure 9, bottom panel) shows a modest 3% difference in overall representation, from 17% minority to 20% minority, over the past eight years.
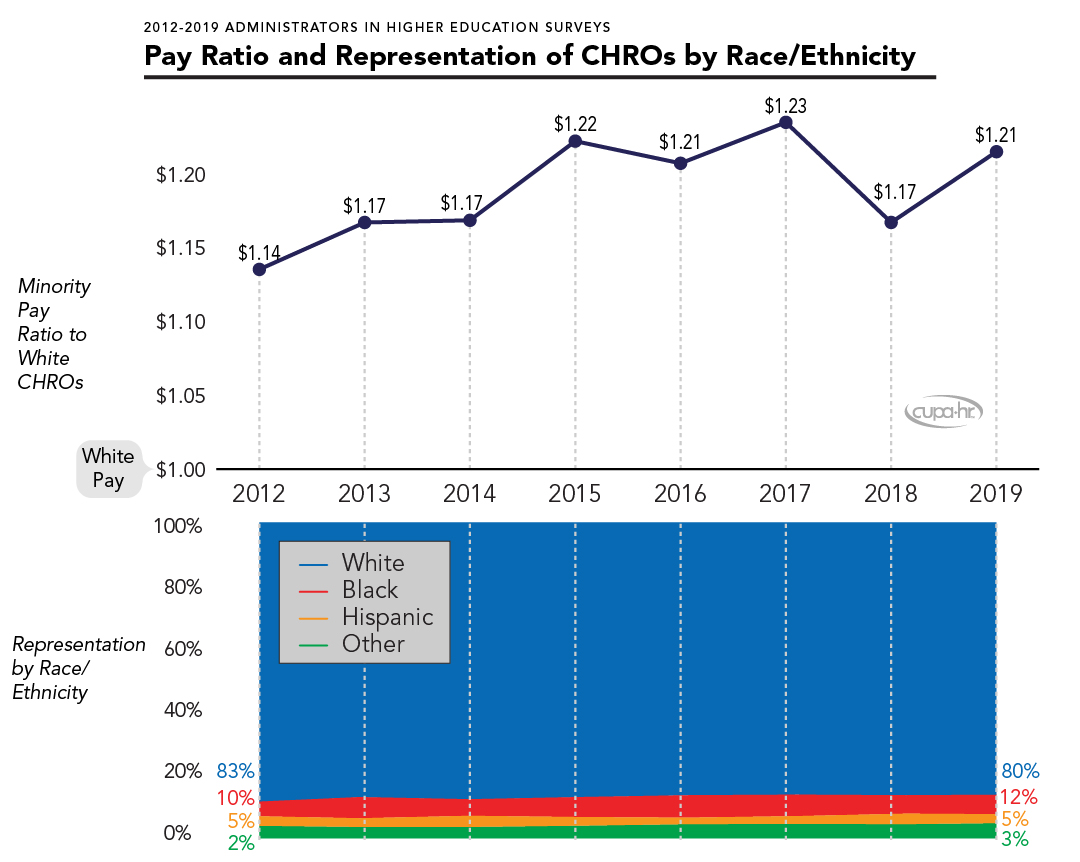
Figure 9. Pay Ratio and Representation of CHROs by Race/Ethnicity
Differences in compensation for minority CHROs overall are related to the fact that doctoral universities pay higher salaries and are more likely to hire a minority CHRO than other types of institutions. Figure 10 shows that at doctoral institutions, 29% of CHROs are racial/ethnic minorities, compared to 20% or less at other types of institutions. Salary differences for CHROs by institutional classification are further explored in the next section.
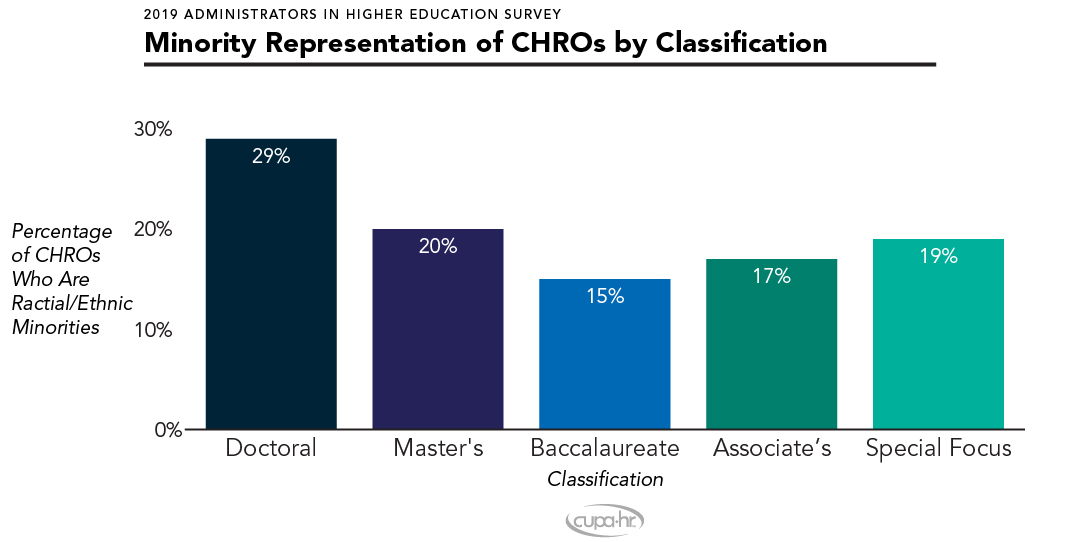
Figure 10. Minority Representation of CHROs by Classification
CHRO Salary by Classification
Median salaries for CHROs differ greatly by the type of institution they serve. Figure 11 compares median salaries of CHROs by classification along with the median size of the workforce for whom they are responsible. Overall, the median annual salary for the CHROs examined in this report is $124,324. CHROs serving in large organizations such as system offices and doctoral institutions are paid the highest salaries, whereas baccalaureate institutions pay the lowest CHRO salaries.8No median FTE data is presented for system offices, as the number and types of institutions in each system varies greatly. The exception to this pattern of higher pay at larger organizations is the special focus category; these institutions have the smallest median workforce size but relatively high CHRO salaries — likely due to the specialized, applied, and varied nature of special focus institutions (colleges of medical science, law, art, design, etc.).
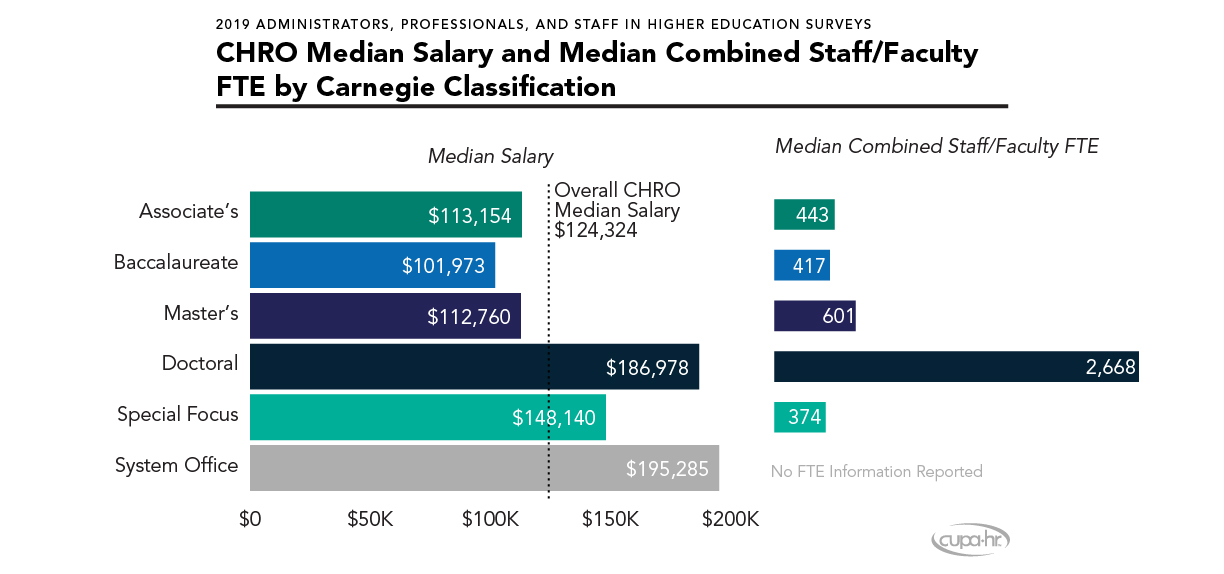
Figure 11. CHRO Median Salary and Median Combined Staff/Faculty FTE by Carnegie Classification
CHRO Reporting Relationship
The position to whom the CHRO reports within an institution also varies by classification, particularly when comparing associate’s institutions to other classifications. Figure 12 shows the percentage of CHROs who report to each top administrative position. These reporting relationships show how HR communicates with top administrators on different types of campuses. At associate’s institutions, 61% of CHROs report directly to the president/chancellor. At doctoral institutions, only 20% of CHROs report directly to the president/chancellor; instead, CHROs at doctoral institutions most commonly report to the chief business officer (35%) or chief financial officer (19%). Master’s and baccalaureate institutions follow a similar model to doctoral institutions.
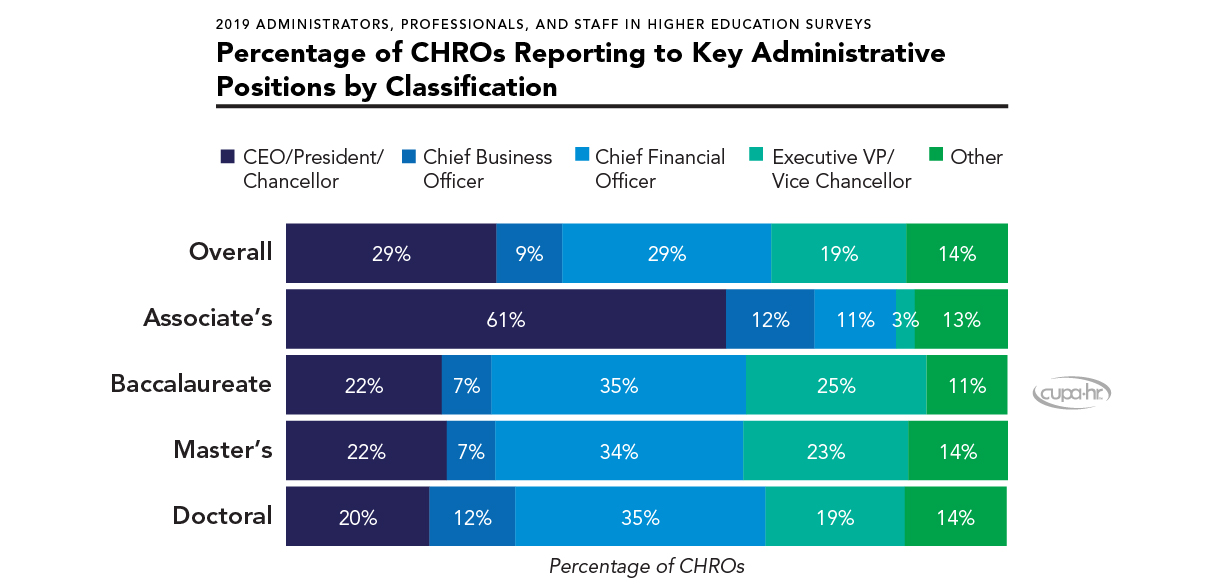
Figure 12. Percentage of CHROs Reporting to Key Administrative Positions by Classification
Conclusions and Key Points
This report details the composition, characteristics, and leadership of higher education HR. Below are some key takeaways:
- White women make up 59% of the higher education HR workforce, followed by racial/ethnic minority women who comprise 23%; the least represented groups in higher ed are Asian and Hispanic men, together accounting for only 2% of all HR employees.
- The representation of men in higher education HR increases with position level, and women’s representation decreases with position level. Men make up 22% of HR leadership positions, but only 16% of entry/mid-level positions and 15% of coordinators. Despite their lower representation, men in professional HR positions (entry/mid-level and senior positions) have a median age that is three years younger than women in these same positions.
- The HR workforce in higher education is generally stable; staffing ratios do not vary much across institutions, and the HR workforce enjoys a lower turnover rate than that of higher education faculty or staff.
- Generalists make up 36% of the HR workforce, with employment (13%), training/organizational development (10%), and benefits (10%) specialists the next most common areas of specialization.
- The demographics of the CHRO position paint a complex picture; although women account for nearly three-fourths of CHROs (74%), they are paid only $0.96 to every dollar paid to CHROs who are men. Racial/ethnic minorities, on the other hand, are paid a median of $1.21 for every dollar paid to White CHROs, although only 20% of all CHROs are racial/ethnic minorities.
- The CHRO reporting relationship varies by institution type; at baccalaureate, master’s, and doctoral institutions, around one-third of CHROs (34%-35%) report to the chief financial officer, and only around one-fifth (20%-22%) report directly to the president/chancellor. For associate’s institutions, however, 61% of CHROs report to the president/chancellor directly, and only 11% report to a chief financial officer.
Related Resources
Citation for this report: Pritchard, Adam, & Schmidt, Anthony. (2020, August). The Higher Ed HR Workforce (Research Report). CUPA-HR.
Printer-friendly Version 1 Learn more about the CUPA-HR Administrators in Higher Education, Staff in Higher Education, and Professionals in Higher Education surveys.