
By Jennifer Schneider and Jacqueline Bichsel | September 2025
Introduction
This report of the CUPA-HR 2025 Higher Education Employee Retention Survey (ERS) provides insight into the evolving factors that underlie employee retention in higher education. Now in its third administration, the 2025 ERS builds on findings from the 2022[1] and 2023[2] surveys to provide a comprehensive and timely understanding of the current higher ed workforce.
The 2023 ERS results confirmed that retention remained a critical concern across higher education post-pandemic, with one in three staff members likely to seek other employment. Many employees cited pay as their primary reason for considering a move; however, the data revealed that feeling valued and having a sense of belonging (both indicators of job satisfaction and well-being) were more important predictors of retention than pay. Employees also reported high levels of overwork and limited access to flexible or remote work options, highlighting persistent gaps between employee needs and institutional practices.
Since then, CUPA-HR data has shown modest signs of improvement. Full-time voluntary turnover in 2024 remained above pre-pandemic levels but declined from the 2022 peak and saw a further slight decrease from 2023, suggesting that while some progress has been made, concerns about employee retention remain pressing (Figure 1).[3] This continued recovery, however, is taking place within a broader environment of sustained workforce pressures.
Retention challenges persist as colleges and universities navigate a shifting higher education landscape and ongoing instability. Demographic changes, including a projected decline in high school graduates, have intensified concerns about long-term enrollment stability in some institutions.[4] Budget constraints also persist for many institutions, prompting difficult decisions about staffing, compensation, and services.[5] Additionally, new federal and state policy shifts, such as the recent enactment of the One Big Beautiful Bill, are reshaping expectations for institutional operations broadly,[6] with specific implications for HR compliance and reporting.[7] Public scrutiny of institutional practices has also grown, particularly in areas related to governance, transparency, and workforce decisions.[8] Finally, many higher ed institutions are contending with the rollback of DEI initiatives (and resulting reassignments or cuts to that aspect of the workforce) in response to changing laws and regulations.[9] These challenges, combined with shifting employee expectations around flexibility, well-being, and workplace culture, continue to shape the employment environment and complicate both institutional operations and employee retention in higher education.[10]
Figure 1. Trends in Voluntary Turnover for Staff
Amid these ongoing shifts in higher education, the 2025 ERS report expands beyond the pandemic-era concerns of the 2023 report to focus on current actionable insights that can guide institutional efforts to retain and support their workforce. The primary goal of this report is to help colleges and universities understand why employees stay or consider leaving and what can be done to create a more sustainable and satisfying work environment.[11] This report focuses on all higher ed employees who are not faculty — administrators, professionals, and non-exempt staff.[12] Notice of the survey was distributed through members of CUPA-HR and other professional organizations.[13]
The 2025 survey asked questions in the following areas:
- Likelihood of looking for other employment opportunities in the next year
- Reasons for looking for other employment
- Remote work policies and opportunities
- Work performed beyond normal hours and duties (overwork)
- Satisfaction with benefits
- Well-being and satisfaction with the job environment
- Retention incentives experienced in the past year
- Challenges for supervisors
- Demographic questions on gender, race/ethnicity, and age
- Characteristics of the employee’s position
This report provides a detailed analysis of responses to each section of the 2025 Employee Retention Survey. It explores the higher education employees who are at risk of leaving, the reasons driving the consideration of other opportunities, and the workplace demands and environment that impact those decisions. The report also presents a predictive model identifying the strongest factors associated with employee retention, offering actionable insights for campus leaders. Where relevant and supported by sufficient response counts, the findings are disaggregated by survey year (2023 and 2025), institutional characteristics, employee demographics, and department/area, to highlight meaningful patterns and disparities.
Respondents
We analyzed data from 3,791 higher ed employees for this report.[14] Approximately 41% of respondents were supervisors, who had a median of five staff reporting to them. Nearly all (96%) respondents worked full-time, and 75% reported they were exempt. The median age of all respondents was 45. More than two-thirds (70%) of respondents were female, and 83% were White (Figure 2).[15] This year’s survey was more representative of men than was the 2023 survey. Men, and to a lesser extent people of color,[16] are underrepresented in the ERS compared to what is reported in CUPA-HR’s annual workforce surveys.[17]
Figure 2. Gender and Race/Ethnicity of Respondents
ERS respondents work in many different departments/areas (Figure 3). The area with highest representation in the survey is academic affairs (23%), followed by student affairs (18%), human resources (16%), and information technology (12%).[18]
Figure 3. Respondent Departments/Areas
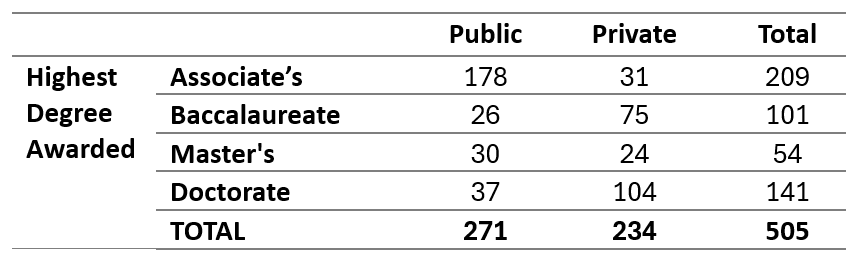
Respondents represented 505 institutions spanning all classifications (Table 1).[19]
Table 1. Institutions Represented in the ERS, by Highest Degree Awarded and Control
Although Likelihood of Leaving Has Declined Since 2023, One in Four Employees Is Likely to Look for a New Job Within the Next Year
Respondents were asked how likely they were to seek other employment within the next year, using a five-point scale ranging from Very Likely to Very Unlikely (Figure 4). One in four higher education employees indicated they were likely or very likely to look for new job opportunities in the next year. This is a significant (25%) decrease from the one-third of employees who reported the same in 2023.[20]
Who is looking for other employment?
The departments most at risk for staff attrition are research and sponsored programs/institutional research (28%), academic affairs (27%), and student affairs (26%), where more than one-fourth of employees report being likely or very likely to seek other employment. In contrast, external affairs appears to be the most stable area, with nearly two-thirds (62%) of employees indicating they are unlikely or very unlikely to look for a new job.
Figure 4. Likelihood of Looking for Other Employment Within the Next Year
All departments saw a decrease in employees’ likelihood of leaving compared to 2023, with considerable declines in external affairs; facilities, operations, and public safety; admissions, enrollment, and financial aid; and academic affairs (Figure 5). In contrast, there was little change from 2023 to 2025 in likelihood of leaving for employees in student affairs and human resources.
Figure 5. Likelihood of Looking for Other Employment Within the Next Year,
Two-Year Change
We compared the mean “likelihood of looking” scores across demographic groups to examine differences in retention risk. Age shows a clear pattern — younger employees are more likely to consider other employment. As illustrated in Figure 6, the average likelihood of seeking new employment declines steadily with age. Employees under age 45 (M = 2.73, SD = 1.38) are significantly more likely to look for other employment in the next year compared to those who are 45 or older (M = 2.33, SD = 1.33).[21] Supervisory status, gender, and race/ethnicity are also associated with retention risk. Non-supervisors (M = 2.59, SD = 1.40), men (M = 2.70, SD = 1.43), and employees of color (M = 2.83, SD = 1.45) are more likely to look for employment than are supervisors (M = 2.48, SD = 1.33), women (M = 2.46, SD = 1.35), and White employees (M = 2.48, SD = 1.35).[22] These patterns are consistent with 2023 findings and highlight the demographic groups at higher risk for turnover.
Figure 6. Likelihood of Looking for New Employment by Age
How serious are employees about leaving?
Over half (56%) of employees who indicated they are likely or very likely to seek other employment in the next year reported having submitted at least one job application in the past 12 months, and another 37% said they had explored other opportunities without applying. Only 7% indicated they had not been actively searching. These findings suggest that most employees considering a job change are taking active steps toward leaving their current roles.
Where are employees looking for other employment?
Employees who indicated they are likely to seek new employment were also asked where they plan to explore opportunities (Figure 7).[23] Nearly three-fourths (72%) said they would consider roles at another higher education institution, followed by private for-profit companies (60%), nonprofit organizations outside of higher education (47%), and roles at their current institution (47%). These results suggest that most employees are open to staying within the higher education sector, either by moving to a different institution or by seeking a new role at their current one, rather than leaving the sector entirely. This pattern closely mirrors findings from 2023.
Figure 7. Where Employees Plan to Look for Other Opportunities
One exception to this finding is employees in the department/area of facilities, operations, and public safety. In this department/group, 76% indicated interest in working for a private for-profit company. By comparison, only 48% of facilities, operations, and public safety employees would consider another higher education institution, and just 40% said they would consider staying at their current institution in a new role.
Why are employees looking for other employment?
Desire for higher pay remains the top reason higher education employees are seeking new job opportunities (Figure 8).[24] Other frequently cited reasons include the opportunity for a promotion, a desire for a different workplace culture, reduced job-related stress, and the ability to work remotely.
More than one-quarter of employees cited job security as a reason they are considering leaving, suggesting it is an emerging element in employees’ decisions to seek other employment. This concern was particularly pronounced among employees in research and sponsored programs/institutional research. In this department/area, more than one-third of employees (34%) listed job security among their top three reasons, which is 10 percentage points higher than any other department/area. Furthermore, 21% of research employees identified job security as their top reason for considering other opportunities, ranking it even above a desire for higher pay. This finding underscores the elevated concern about job stability among research staff. Given the ongoing instability in research funding and shifting institutional priorities, it is not surprising that job security is a heightened concern for these employees.[25]
One of the most notable shifts from 2023 is the sharp decline in employees citing flexible scheduling as a reason for seeking new employment. In 2025, only 17% selected this option, down from 32% in the previous survey. This decline may suggest that employees are now placing greater emphasis on compensation, career advancement, or job security, or that institutions have made meaningful improvements in flexible work options. The latter explanation is supported by CUPA-HR’s Benefits, Employee Experience, and Structure Survey (BEES Survey), which reported that most institutions offer flexible schedules for exempt staff (75%) and non-exempt staff (66%) in 2024-25.[26] Taken together, these reasons reflect evolving workforce expectations around pay, well-being, and workplace culture, alongside a changed experience with flexible scheduling.
Figure 8. Reasons Employees Are Seeking New Opportunities
Remote/Hybrid Work: Gaps Remain Between What Exists and What Employees Want
Despite evolving preferences since the pandemic, many higher education employees continue to experience a mismatch between their desired and actual work arrangements (Figure 9).
Only 28% of employees report currently working in either a hybrid (partially on-site and partially remote) or fully remote arrangement, yet 61% express a preference to have hybrid or remote work.[27] This 33-percentage-point gap remains unchanged from 2023, suggesting institutions overall have not made progress in aligning work arrangements with employee preferences. These findings reflect broader workforce trends,[28] with national research indicating sustained interest in hybrid and remote work even as actual remote work levels have plateaued.[29]
In 2025, actual work arrangements have shifted back in the direction of on-site work. Nearly three-fourths (72%) of employees now work completely or mostly on-site, up from two-thirds (66%) in 2023. Meanwhile, hybrid arrangements have declined from 24% to just 16%, and fully or mostly remote work remains unchanged at 11%.
Work preferences have also shifted modestly. In 2025, 39% of employees prefer working completely or mostly on-site, up from 31% in 2023. Hybrid work, though still a popular choice, is no longer the top preference. Meanwhile, the share of employees preferring fully or mostly remote work has declined from 28% to 23%. It should be noted that it is possible that, given the high turnover rates in higher education in the years following the pandemic,[30] many employees may have left their positions for other remote or hybrid work opportunities, leaving in place a greater proportion who are satisfied working mostly or completely on-site.
Even as preferences have evolved among the workforce, most employees continue to report that their roles are appropriate for remote work. In 2025, 62% agreed that most of their duties could be performed remotely, a slight decline from 68% in 2023. This suggests that many roles could support more flexible arrangements than employees currently experience. Notably, CUPA-HR data show that 82% of institutions offer full-time hybrid options and 71% offer full-time remote options to at least some employees, demonstrating that policies are already in place at most institutions to support these work arrangements.[31]
Figure 9. Current and Preferred Work Arrangements
Hybrid and remote work arrangements vary by department/area.
Work arrangements differ considerably across departments, with notable gaps between what employees experience and what they prefer (Figure 10). Information technology and human resources report the highest levels of remote or hybrid work. More than half (54%) of information technology employees currently work in either a fully or partially remote arrangement, the highest of any department/area. However, that falls short of the more than three-fourths (77%) of information technology employees who would prefer such arrangements, indicating an opportunity to enhance the retention of these employees. Similarly, 41% of human resources employees are working remotely or hybrid, compared to the 72% who would prefer such an arrangement.
By contrast, some departments remain overwhelmingly on-site. It is unsurprising that nearly all (96%) facilities, operations, and public safety employees work completely or mostly on-site, as the very nature of their work requires it. Facilities, operations, and public safety employees appear to understand this — only 14% report that all or most of their duties could be performed remotely, and 76% prefer all or mostly on-site work. In contrast, although 85% of student affairs employees work completely or mostly on-site, nearly half (47%) state that most or all of their duties could be performed remotely and only 49% prefer to work all or mostly on-site.
White men are most likely to prefer on-site work.
Demographic patterns indicate that work arrangement preferences are not uniform across the workforce. Men are far more likely than women to prefer on-site work (50% vs. 35%), and White employees are more likely than employees of color to prefer on-site work (41% vs. 27%). These differences become even starker when looking at the intersection of race and gender: More than half of White men (52%) prefer on-site work, compared to just one-fourth (25%) of women of color. Age also plays a role. Forty-three percent of employees aged 45 and older prefer on-site work, whereas only 35% of those under 45 do. Variation by gender, race, and age reflects broader differences in employee experience and workplace expectations, underscoring the complexity of work arrangement preferences across demographic groups.
Overall, the discrepancy between employees’ current and preferred work arrangements has slightly decreased, but notable gaps remain.
To assess the disconnect between employees’ preferred and actual work arrangements, a misalignment score was calculated by subtracting each respondent’s current arrangement score from their preferred score (on a 5-point scale).[32] Higher scores indicate greater misalignment between employees’ preferred and actual work arrangements (Figure 10).
The overall average misalignment score was 0.80, reflecting a slight improvement from 0.86 in 2023. This still indicates employees are working in arrangements that are less flexible than they would prefer. Department-level comparisons reveal meaningful variation in this disconnect — misalignment is greatest in fiscal and business affairs (0.97), academic affairs (0.90), and student affairs (0.88). In fiscal and business affairs, for example, over three-fourths (76%) of employees work completely or mostly on-site, yet only one-third (34%) prefer this arrangement. Notably, three-fourths of employees in this area also report that their duties can be performed remotely.
On the other end of the spectrum, departments such as facilities, operations, and public safety (0.54), information technology (0.61), and research and sponsored programs/institutional research (0.69) show the lowest levels of misalignment. This is not entirely surprising for facilities, operations, and public safety, where only 14% of employees say their duties can be performed remotely. However, the low misalignment scores in information technology and research/sponsored programs are more noteworthy, as a large majority of employees in these departments (79% and 74% respectively) report that their duties are remote-capable. These employees also tend to have more flexible work options, which further reduces the likelihood of misalignment.
These findings point to a persistent disconnect between employees’ work preferences and their actual arrangements and are particularly concerning in departments/areas where remote work is both feasible and desired.
Figure 10. Misalignment Between Preferred and Current Work Arrangement
by Department/Area
More Than Half of Higher Ed Employees Work Additional Hours Beyond Full-Time Expectations
Heavy workloads remain a defining feature of employment in higher education.
More than half of employees (51%) report working regularly beyond what their institution defines as full-time, slightly higher than the 50% who reported the same in 2023. Although this indicates a continuing pattern, the majority of those working extra time are doing so modestly: The most common range of additional hours was just one to five per week (24%). Another 17% reported working six to 10 additional hours and 11% said they work 11 or more extra hours each week (Figure 11).
Most employees report only modest additional hours worked, but some departments have far higher proportions working beyond full-time. Human resources is the department/area with the highest share of employees working beyond full-time (60%), followed by external affairs (58%) and information technology (57%).
Figure 11. Distribution of Weekly Additional Hours Worked by Department/Area
All departments reported a rise in additional hours except for four: admissions, enrollment, and financial aid; facilities, operations and public safety; research and sponsored programs/institutional research; and human resources, which either remained flat or experienced a decline.
The biggest increases in additional hours worked between 2023 and 2025 occurred in information technology (rising from 43% to 57%) and external affairs (from 50% to 58%). In contrast, admissions, enrollment, and financial aid saw the largest decrease, dropping from 52% to 43% over the same period.
Although the overall share of employees working beyond full-time expectations has increased only slightly since 2023, departmental trends vary. Most departments have seen notable increases in the proportion of employees reporting additional hours, whereas a few have experienced modest declines.
Despite some signs of improvement in retention, overwork remains a widespread issue across higher education.
Half of all employees strongly agree or agree that their work often causes them to feel anxious or stressed, highlighting the emotional toll of workload pressures.[33] A majority continue to take on responsibilities beyond their original roles, with 61% strongly agreeing or agreeing they have added duties outside their original job descriptions and 53% strongly agreeing or agreeing they have taken on additional responsibilities from colleagues who have left. These patterns point to a continued reliance on remaining staff to fill workforce gaps, which undoubtedly contribute to burnout and dissatisfaction, perpetuating the turnover cycle.
Rising expectations are also fueling overwork.
More than half of employees (54%) agree that demands or expectations from management have increased over the past year, and 43% agree that they need to work beyond their scheduled hours to complete all their duties.[34] Nearly one in five employees (21%) agree that putting in extra hours is important for performance evaluations and promotion considerations, and more than one-fourth of employees (28%) agree it is considered normal to work on their days off. Added responsibilities are another driver of workload strain: 61% of employees agree they have taken on duties outside the scope of their original job description, and more than half (53%) agree they have absorbed the responsibilities of staff who have left the institution. Although only 14% of employees agree that management explicitly encourages extra hours, nearly one-third (29%) agree they are expected to respond to emails and phone calls outside of regular work hours. The cumulative effect of these demands is evident, with half of employees (50%) agreeing that their work often causes them to feel anxious or stressed, and more than one-fourth (27%) agreeing it is difficult to take paid time off for vacations or personal obligations. These findings suggest that heavier workloads, shifting job expectations, and blurred boundaries between personal and professional life remain significant challenges for many employees.
Supervisors Have the Heaviest Workloads, Yet They Are Least Likely to Leave
Although overwork is widespread among higher ed employees, it is particularly pronounced among supervisors. Nearly three-fourths (72%) of supervisors, defined as employees who oversee at least one direct report, strongly agree or agree they work additional hours beyond their institution’s full-time expectations, compared to just over one-third (36%) of non-supervisors (Figure 12). This gap is even more pronounced among those putting in substantial extra time: 21% of supervisors reported working 11 or more additional hours per week, whereas only 4% of non-supervisors reported the same. The share of supervisors working extra hours has risen slightly from 70% in 2023 to 72% in 2025. This persistent divide highlights a continued imbalance in workload between supervisory and non-supervisory roles. However, despite carrying heavier workloads and greater demands, supervisors are less likely than non-supervisors to seek other employment, as noted in the previous section.
Figure 12. Distribution of Weekly Additional Hours Worked by Supervisors and Non-Supervisors
Supervisors report greater workload demands than non-supervisors.
Supervisors in higher education consistently report greater workload demands than their non-supervisory peers, extending well beyond additional hours to include absorbed responsibilities, rising expectations, and pressure to remain available outside regular work hours. Supervisors are more than twice as likely as non-supervisors to agree that it is normal to work on days off and that their job duties require extra time to complete (Figure 13).
Figure 13. Work Demands for Supervisors and Non-Supervisors
The results illustrated in Figures 13 and 14 underscore key differences in the day-to-day realities of supervisory roles, particularly around time off and workload demands.
Compared to non-supervisors, supervisors are:
- Nearly twice as likely to report difficulty taking paid time off (38% vs. 20%)
- Almost twice as likely to say they are not able to take breaks (23% vs. 12%)
- More likely to have absorbed the responsibilities of other staff who left (61% vs. 48%)
- More likely to have experienced an increase in job expectations (64% vs. 49%)
- More than twice as likely to be expected to respond outside of regular hours (42% vs. 19%)
- More likely to say their job causes them to feel anxious (60% vs. 45%)
The combination of supervisors’ longer hours, greater expectations, and fewer opportunities to disconnect raises ongoing concerns about burnout and the sustainability of supervisory roles in higher education.
Figure 14. Changes in Work Expectations Over Past Year for Supervisors
and Non-Supervisors
Supervisors’ top challenge is securing funding.
Supervisors were asked to rate the level of challenge they experience across various aspects of their role (Figure 15).[35] Two items introduced in the 2025 survey point to a growing focus on fiscal issues. Securing adequate funding emerged as the top challenge, with 38% rating it as very challenging, and nearly one-quarter also reported that planning and managing the budget is very challenging.
Although supervisors continue to face staffing-related challenges, several of these challenges have eased since 2023. The percentage who found filling vacant positions very challenging fell from 52% in 2023 to 34% in 2025 and the share citing staff retention as very challenging declined from 31% to just 16%.
Managing remote staff remains a low-level concern. In 2025, just 7% of supervisors rated it as very challenging, whereas two-thirds (67%) said it was not a challenge at all. Given the misalignment gap between employees’ preferred and actual hybrid/remote work arrangements, expanding these opportunities for qualified staff may help strengthen retention by easing recruitment and vacancy challenges, while not adding to supervisors’ existing burdens.
Figure 15. Supervisor Challenges
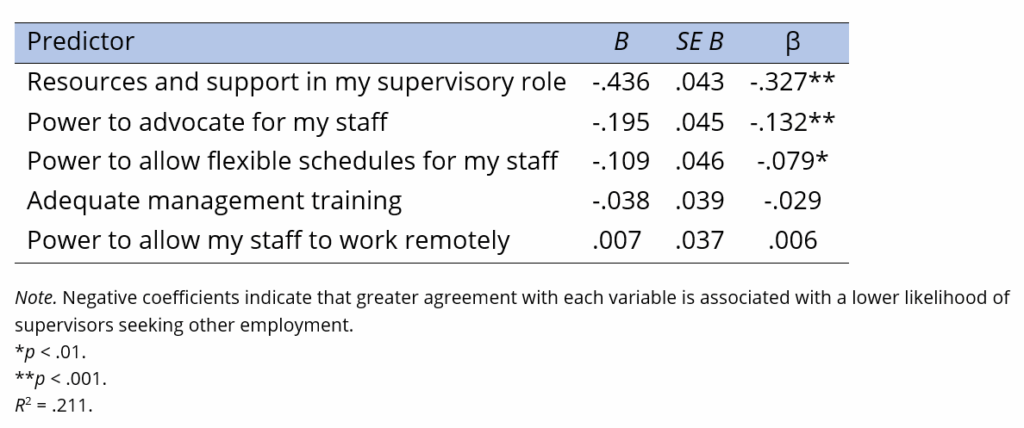
Supervisors who have resources and support are less likely to seek other employment.
When supervisors have institutional support, specifically access to resources, decision-making power, and the ability to advocate for their staff, they are less likely to seek other employment. Table 2 presents the results of a multiple regression analysis examining whether five variables predict supervisors’ likelihood of seeking other employment in the next year: (1) management training; (2) resources and support; and three dimensions of power: (3) the power to advocate for their staff, (4) the power to allow flexible schedules, and (5) the power to allow remote work.[36]
Multiple regression analysis allows us to examine whether each variable uniquely predicts supervisors’ likelihood of seeking other employment, accounting for the influence of other variables in the model. It also identifies which predictors are relatively stronger.[37] Table 2 (column 3) displays the standardized beta coefficients (β), where larger absolute values indicate stronger relationships. All coefficients are negative, meaning that higher agreement with each variable is associated with a lower likelihood of supervisors seeking other employment. For instance, supervisors with more power to advocate for their staff are less likely to consider leaving their institution.
Three of the five variables significantly predict supervisors’ likelihood of leaving: having access to resources and support in their supervisory roles, the power to advocate for staff, and the power to allow flexible schedules. Of these, resources and support emerged as the strongest predictor. The power to allow remote work and the receipt of adequate management training did not significantly predict turnover intentions.
Compared to prior years, notable shifts have occurred in which variables most strongly predict supervisors’ likelihood of seeking other employment. In 2023, the power to advocate for staff was the strongest predictor of retention, with management training also playing a key role. By 2025, however, resources and support emerged as the most influential variable, followed by the power to advocate for staff and the power to allow flexible schedules. These findings suggest that although advocacy and flexibility remain important, supervisors’ access to the resources and support they need to do their jobs effectively has become the most critical element in predicting retention for supervisors.
In summary, current and past results provide consistent evidence that ensuring supervisors have adequate resources and support and the power to advocate for their staff plays a critical role in reducing their likelihood of seeking other employment. However, one-fifth of supervisors report not having these key supports. Only 61% of supervisors agree they have the resources and support they need, and just 77% agree they have the power to advocate for their staff.
Table 2. Predictors of Supervisors’ Likelihood of Looking for Other Employment
Job Satisfaction Has Improved; Fair Pay Remains an Explicit Concern
Two-thirds (66%) of higher education employees strongly agree or agree that they are satisfied with their jobs (Figure 16), representing a 14% increase from 2023, when 58% reported agreeing they are satisfied with their jobs.[38] Despite this overall improvement, satisfaction is not evenly experienced across all groups. Supervisors, women, White employees, and those aged 45 and older report being more satisfied than do non-supervisors, men, employees of color, and those under 45.
The most positive aspects of the work environment, as reflected in agreement percentages, include a good relationship with supervisors (82%), sense of purpose (82%), and engagement with one’s work (78%).[39] Additionally, more than seven in 10 employees agree that their opinions are asked for (72%) and that they have clarity on their job duties (71%).
However, there are still notable areas of concern. One in four employees (24%) disagree that they are recognized for their contributions, and 16% disagree that they are able to bring up problems or tough issues at work. One in five (20%) disagree that they are comfortable discussing current events with coworkers. Additionally, 17% disagree that they feel secure in their positions, and 16% disagree that they have a sense of belonging, suggesting that a significant portion of the workforce may be experiencing disconnection or uncertainty in the workplace.
Most strikingly, employees express dissatisfaction with pay. Forty-three percent of employees disagree that they are paid fairly, a ten-percentage-point increase from 2023. Echoing patterns seen in job satisfaction, employees of color, employees under 45, and non-supervisors are significantly less likely to agree they are paid fairly than their counterparts — White employees, those aged 45 and older, and supervisors.[40] Moreover, employees in academic affairs, student affairs, and facilities, operations, and public safety are the most likely to disagree that they are paid fairly.
Figure 16. Satisfaction With Work Environment
Figure 17 highlights how employees perceive their broader work environment. Over two-thirds agree they would recommend their department/area (71%) and their institution (67%). Employees tend to view their immediate work environment positively; however, their views of the broader institution reveal persistent concerns. Nearly half (44%) disagree that they have opportunities for advancement, and 17% disagree that their institution provides opportunities for professional development. One in three (33%) disagree that their institution communicates effectively, and only about half (52%) agree that institutional leaders care about their well-being. Just one-fourth (26%) agree that their institution values long-term employees. Financial perceptions are also mixed, with only 45% agreeing that their institution is financially stable, leaving many uncertain about its future viability. Together, these findings point to ongoing challenges in communication, advancement, recognition, and financial confidence at the institutional level. One bright spot is safety: Just 4% of employees report feeling unsafe from violence or crime, down from 11% in 2023.
Figure 17. Satisfaction With Institutional Environment
Workplace climate perceptions are less positive among employees of color.
Employees’ perceptions of their work and institutional environments differ meaningfully by race/ethnicity and, to a lesser extent, by gender.
Employees of color consistently report lower agreement than White employees on nearly all items measuring workplace and institutional climate. The most pronounced disparities appear in areas related to inclusion and trust. Compared to White employees, employees of color are:
- Less likely to agree that their institution makes efforts to understand and address the needs of employees from diverse backgrounds
- Less likely to see diversity reflected in leadership
- Less confident that institutional leaders act ethically and responsibly in times
of crisis - Less likely to feel safe from violence or crime at work
One notable exception relates to institutional financial stability. Although more than half of all employees express concern about their institution’s financial health, this concern is more common among White employees than among employees of color.
Differences by gender are less widespread and generally reflect smaller gaps. However, women tend to report more positive perceptions than men across several key areas. For example, women are more likely to agree that they have clarity in their job role and that their personal values align with the institution’s mission. The only area where men report higher agreement than women is in feeling safe from violence or crime at work.
Core Benefits Are Highly Rated; Family Support Benefits Are Not
Employees express high satisfaction with core benefits (Figure 18).[41] Satisfaction is highest for paid time off (77%), retirement benefits (74%), health insurance benefits (71%), and tuition benefits (70%). In contrast, employees are least satisfied with remote work policies, with 28% of employees reporting they are very dissatisfied or dissatisfied. Dissatisfaction is also evident for family support benefits, with 18% of employees dissatisfied with childcare and eldercare benefits and 12% with parental leave policies. However, encouragingly, dissatisfaction has declined since 2023, when 28% reported dissatisfaction with childcare and eldercare benefits and 17% with parental leave.
Satisfaction with benefits varies across employee groups and institution types. More employees at public institutions reported they were satisfied with certain benefits than those at private, not-for-profit institutions in several key areas, including retirement benefits, health insurance, parental/family leave, and childcare and eldercare support. Differences by race/ethnicity and gender also emerged. White employees reported being more satisfied than employees of color with retirement benefits, tuition benefits, and the amount of paid time off. Women reported they were more satisfied than men with tuition and health insurance benefits, but were less satisfied with schedule flexibility, remote work policies, and childcare and eldercare benefits. These disparities suggest that benefit experiences are not uniform and highlight the importance of ensuring that benefit policies and practices support all employees.
Figure 18. Satisfaction With Benefits
Satisfaction with remote work policies varies by employees’ current work arrangements.
Employees are least satisfied with their institution’s remote work policy. To better understand this dissatisfaction, the following analysis focuses only on employees who indicated their responsibilities could be performed remotely. Looking at current work arrangements, employees who work entirely or mostly on-site are the least satisfied: 35% of this group report being very dissatisfied or dissatisfied with their institution’s remote work policy (Figure 19). In contrast, dissatisfaction is substantially lower among employees with hybrid (10%) or fully/mostly remote (7%) arrangements. These patterns suggest that current remote work policies do not align with the expectations or needs of employees in remote-compatible roles.
Figure 19. Current Work Arrangement by Satisfaction With Remote Work Policy
Retention Incentives: Annual Pay Increases Have Declined; More Informal Retention Strategies Are Common
Despite persistent concerns about retention, fewer higher ed employees are receiving compensation-based incentives than they were in 2023. Only 43% of employees report receiving a salary increase in the past year, a sharp decline of 10 percentage points from 2023.[42] As shown in Figure 20, the most common incentive by far is informal recognition for doing good work. However, even that most common incentive, one that does not cost anything, is received by only 72% of employees. The next most common incentive is having a flexible work environment, reported by 58% of employees. Only about half (52%) of employees reported receiving professional or career development opportunities. Other forms of strategic incentives were far less common: only 15% received additional time off, 11% received formal recognition, and fewer than 10% received a promotion, stay interview, performance bonus, or retention bonus.
Figure 20. Retention Incentives Received in the Past Year
The Strongest Predictor of Retention Is Still Job Satisfaction and Well-Being
Throughout this report, we hold the premise that a good proxy for the measurement of retention is the likelihood of staff looking for other employment. It is important to engage current employees in a regular dialogue about their satisfaction with their work environment, pay, and benefits, as outlined in the previous sections of this report. Waiting to ask why an employee is leaving during an exit interview is too late to implement incentives, and exit interviews provide little indication of the dissatisfaction that exists among remaining employees. In this section, we provide a model that shows which variables are the strongest predictors of retention. This model can help institutions target and craft their own approach to retention efforts, whether it be through stay interviews, surveys, incentives, or professional development.
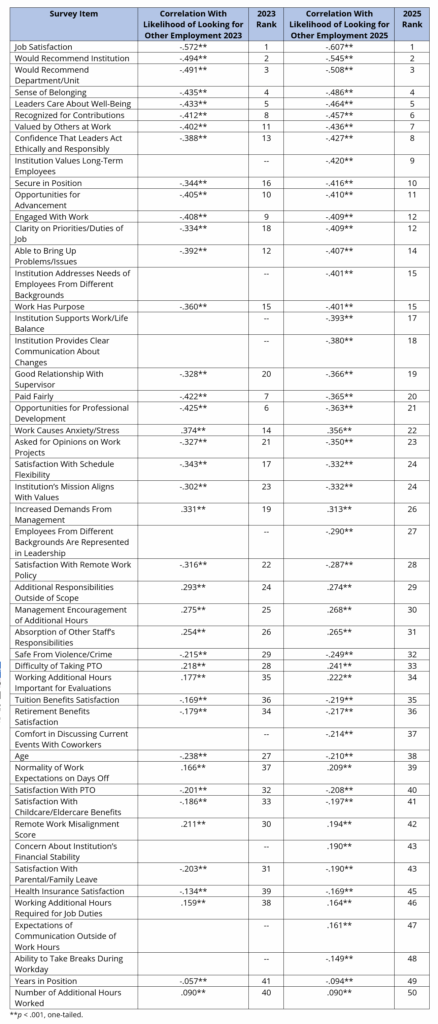
We start by looking at the correlations between each item of the survey and the likelihood of looking for other employment. These correlations are displayed in Table 3 in order of strength for 2025 data. Every item was significantly correlated with the likelihood of looking for other employment. The strongest correlate of retention is the same as it was in 2023 — general job satisfaction. As job satisfaction increases, the likelihood of looking for other employment decreases. In fact, the five strongest correlates are unchanged from 2023. The only difference is that these correlates in 2025 are even stronger than they were in 2023.
Table 3. Correlations Between Survey Items and the Likelihood of Looking for Other Employment
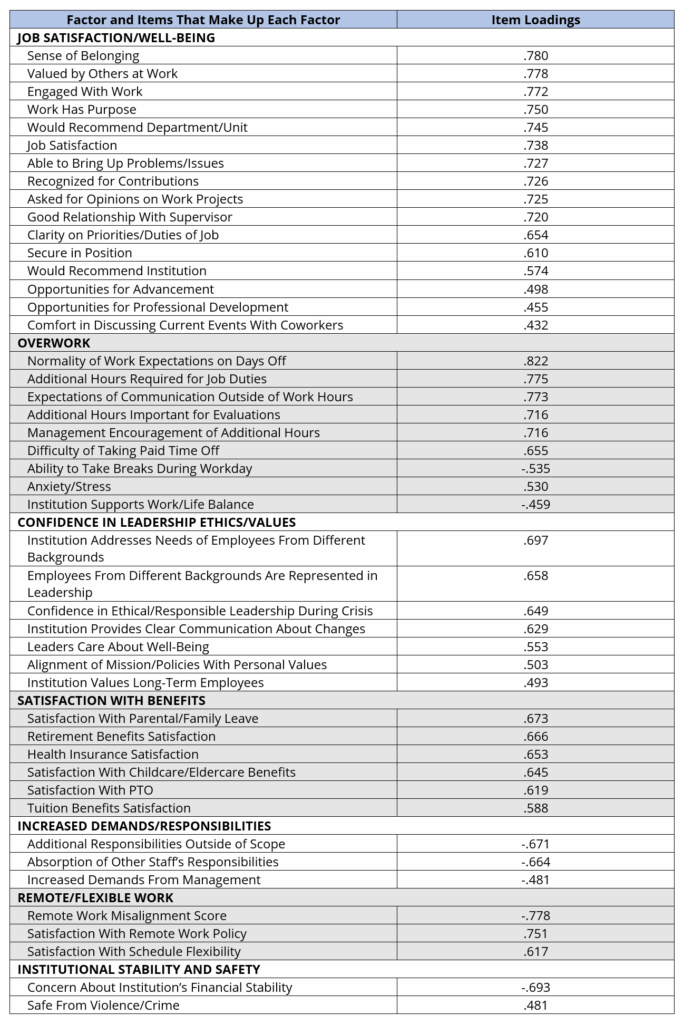
The problem with simply looking at correlations in isolation is that many of the items are correlated with one another, making it difficult to discern the independent contribution of each item in predicting retention. We therefore performed a factor analysis to see which of the survey variables “hang together” (i.e., highly correlate with one another).[43] The analysis found a total of seven factors, labeled and summarized in Table 4.[44] These factors are Job Satisfaction/Well-Being, Overwork, Confidence in Leadership Ethics/Values, Satisfaction With Benefits, Increased Demands/Responsibilities, Remote/Flexible Work, and Institutional Stability and Safety. This model is very similar to the one generated in our 2023 survey, with the exception of the last factor. Institutional Stability and Safety emerged as a new factor in 2025, illustrating that perceived stability and safety independently impact an employee’s choice to leave or stay in their position.
The benefit of a factor analysis is that it boils down a large number of items into factors that are better understood and are not redundant. Each factor is listed with the items that “load” on it in Table 4. The item loading value indicates the strength with which the item loads on the factor. For example, Job Satisfaction/Well-Being is the factor with the most items underlying it. The strongest item that underlies Job Satisfaction/Well-Being is whether an employee feels a sense of belonging, followed closely by feeling valued by others at work. In looking at individual item correlations (Table 3), we saw that general job satisfaction has the highest correlation with the likelihood of looking for other employment. However, the fact that general job satisfaction correlates so strongly with many other items obscures a detail that factor analysis uncovers: The most important aspects of job satisfaction and well-being are a sense of belonging, feeling valued, being engaged, and feeling one’s work has purpose.
Table 4. Seven Factors Underlying Employee Retention
The next step in the formation of a model is to assess how strongly each of these identified factors predict retention (the likelihood of looking for other employment). We do this using a multiple regression analysis. As explained in a previous section, multiple regression allows us to assess the relative strength of the predictors of retention. We entered each of the identified factors into a simultaneous multiple regression, along with age and whether employees believe they’re being paid fairly, to see whether and how strongly they predict the likelihood that employees will look for other employment. The results are presented in Table 5 in order of their strength of prediction.
Examining the standardized beta weights (column 3), we see that Job Satisfaction/Well-Being is the strongest predictor (by far) of retention, as it was in 2023. In other words, as job satisfaction increases, the likelihood of looking for other employment decreases. The fact that Job Satisfaction/Well-Being remains the strongest predictor — well ahead of any other factor — points to the robustness of the model. It also indicates that attending to the items that underlie this factor will provide the most return when developing retention plans and targeting resources.
The second largest predictor of retention is Confidence in Leadership Ethics/Values. The greater confidence employees have in their leadership to represent and address the needs of employees from different backgrounds, as well as to respond ethically in a crisis, the less likely they will be to look for other employment. This factor has leapfrogged to second place from seventh place two years ago in terms of its strength in predicting retention. Also, in looking at the items that underlie the Confidence factor, it is important that leaders adequately communicate their decisions to staff, along with the ethics and values that ground these decisions.
Every factor entered into the regression was a statistically significant predictor of retention (as indicated by a lower likelihood of looking for other employment). However, some factors were relatively weak predictors. For example, although the primary reason employees say they are looking for other employment is higher pay (Figure 8), being paid fairly is actually the weakest predictor of retention in our analysis. In fact, age is a much stronger predictor of retention than is fair pay, with older employees being less likely to look for other employment (as illustrated in Figure 6).
Overwork, defined by the expectation of working additional hours during what is supposed to be time off, continues to be a moderately strong negative predictor of retention, and in fact has gained in strength since 2023. In other words, the more an employee is expected to work outside of normal hours, the greater likelihood they will look for other employment. What is interesting, however, is how the factor of Increased Demands/Responsibilities has changed in the past two years. In 2023, this factor, like Overwork, was a negative predictor of retention. However, it is now a positive predictor of retention. In other words, the more additional responsibilities an employee has outside the scope of their job description, the more they absorb the responsibilities of other staff, and the more they have experienced increased demands from their manager, the less likely they are to look for other employment. This could possibly be due to the fact that the nature of increased demands has changed since the immediate-post-pandemic era. As turnover has abated somewhat, employees may feel as though increased responsibilities and demands signify increased confidence from managers, whereas employees in 2023 may have felt that increased responsibilities and demands foisted on them by historic departures were unwanted and unrewarded.
Whereas added demands and responsibilities added to the overwhelm staff were experiencing in the pandemic’s wake in 2023, they may now be experienced as increased trust, reliance, career growth, and recognition, which are all positive correlates of retention. This shift means that leaders should be mindful of how additional demands and responsibilities are framed, supported, and rewarded. The shift also underscores the importance of context: Additional demands and responsibilities are positive when they are viewed as opportunities but negative when they are perceived as simply more work with little reward.
Table 5. Predictors of Retention (From Strongest to Weakest)
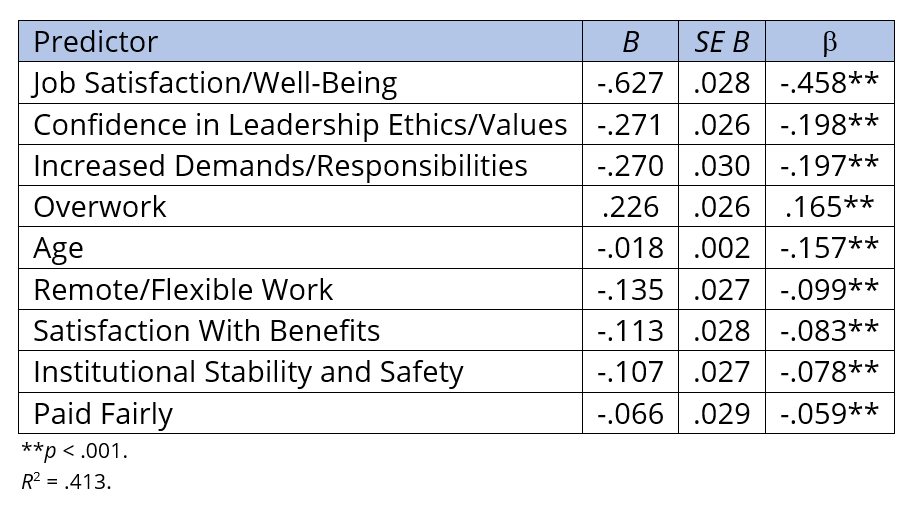
Figure 21 provides a graphical depiction of our retention model. The size of the circles is directly proportional to the strength of the prediction of each factor or variable. This model is an indicator of where the direction of resources will provide the greatest opportunity to increase employee retention. For example, those looking to make sizeable inroads in attenuating a retention crisis at their institution would be best served to direct most of their resources to improving job satisfaction and well-being, attending to the items that underlie it: improving employees’ sense of belonging, making employees feel valued, and strengthening engagement, among other actions (Table 5).
Figure 21. CUPA-HR Retention Model
Conclusions
Fewer employees are actively considering leaving compared to 2023, but retention remains a concern. In 2025, one-fourth of higher ed employees reported they were likely or very likely to look for other employment in the next year, a drop from one-third in 2023. And more than half are at least somewhat likely to leave, indicating that institutions must remain focused on strategies to retain their workforce.
Younger employees, men, employees of color, and non-supervisors are more likely to seek other employment. Employees under age 45, men, employees of color, and non-supervisors all reported a significantly higher likelihood of looking for other opportunities than their respective counterparts. These findings reinforce patterns seen in 2023 and suggest targeted retention strategies may be needed for these groups.
Most employees who are considering other employment are taking concrete steps. Among employees who said they were very likely, likely or somewhat likely to leave, 56% had submitted at least one application in the past year and another 37% had explored job opportunities.
Employees are still open to staying in higher education. Although 60% of job seekers are looking outside higher ed, particularly in the private sector, 70% said they are also looking at other higher education institutions, and nearly half are open to exploring other roles within their current institution. These results suggest that although retention is a concern, many employees would stay in higher ed if given the right opportunities.
Pay remains the leading reason employees say they are seeking other employment, but other reasons are also driving job-seeking. Although the most common reason cited for leaving is still to receive a pay increase, employees also report concerns about workload, job expectations, limited flexibility, and a desire for stronger recognition and connection at work.
Workload is high, particularly among supervisors. Over half of all employees report regularly working more than full-time hours, and this rate is even higher among supervisors. Supervisors are also more likely than non-supervisors to absorb extra responsibilities, work on weekends, and report rising job expectations. These continued workload pressures may contribute to burnout and long-term retention challenges.
Significant gaps remain between employees’ preferred and actual work arrangements. Sixty-one percent of higher education employees prefer hybrid or remote work, yet only 28% currently have such arrangements. This misalignment suggests that employees who want hybrid or remote options but lack access are more likely to be dissatisfied, particularly in remote-compatible roles, creating risks for satisfaction and retention.
Despite the overwork and rising expectations supervisors face, they are less likely to seek other employment when they feel supported. Supervisors who can advocate for their staff, allow flexible schedules, and receive institutional backing and training are significantly less likely to consider leaving. This underscores the importance of empowering supervisors not only to support their teams but also to reduce their own turnover risk.
Overall job satisfaction has improved since 2023, but perceptions of fair pay have worsened, making compensation a more prominent concern despite the gains in satisfaction. Further, the persistent gaps in both satisfaction and pay perceptions, particularly among employees of color, non-supervisors, and those under 45, point to the need for strategies that address fair pay alongside broader efforts to improve the work environment.
Institutional climate remains a challenge, particularly for employees of color. Concerns about communication, advancement opportunities, leadership support, and financial stability are common, but they are more pronounced among employees of color, who consistently report lower agreement than White employees on most measures of workplace and institutional climate, but especially in areas related to inclusion, trust, and diversity in leadership.
Pay increases and promotions are not widely experienced. Just over half of employees say they’ve received a pay increase in the past year and fewer report receiving other more formal incentives like promotions, bonuses or stay interviews. These missed incentives could undermine retention efforts and employee engagement.
Job satisfaction/well-being is the strongest predictor of retention. Employees are far less likely to consider leaving when they feel a sense of belonging, feel valued by others at work, feel engaged with their work, and feel like their work has purpose. In fact, these aspects are stronger predictors of retention than is the perception of fair pay. The CUPA-HR Retention Model also shows that employee confidence in leadership ethics and values is a secondary factor in predicting retention. In addition, having increased demands and responsibilities is now a positive rather than a negative predictor of retention.
Recommendations
Higher ed leaders should continue to treat employee retention as a strategic priority. Overall intent to leave has declined since 2023, yet the risk remains high, especially among younger employees, men, employees of color, and non-supervisors. This year’s survey highlights the need for a sustained, data-informed strategy to strengthen workforce retention. The recommendations below focus on the most actionable areas institutions can address now to improve stability and commitment over the long term.
Center retention efforts around job satisfaction and well-being. Job satisfaction remains the strongest predictor of retention, with employees far less likely to look for other opportunities when they feel valued, connected, and supported in their roles. A sense of belonging is the strongest aspect of satisfaction and well-being, with employees who feel included and recognized far more likely to stay. Institutions can strengthen a sense of belonging by recognizing contributions, reinforcing the purpose of work, encouraging employee voices, and fostering supportive day-to-day relationships, particularly with supervisors. These efforts cost relatively little but yield some of the highest returns for improving retention.
Reduce overwork and unrealistic expectations. Overwork continues to be a defining challenge, particularly among supervisors. Supervisors are not only working longer hours, but they are also absorbing the responsibilities of vacant positions, facing rising expectations, and struggling to take time off. Institutions must take meaningful steps to prevent burnout by managing workload and expectations. Position additional demands and responsibilities as opportunities for career development and growth and reward them as such with promotions and increases in pay.
Empower supervisors with the authority and resources to lead effectively. Results indicate that supervisors who feel supported by their institution through access to resources, the ability to advocate for their staff, and flexibility in managing schedules are significantly less likely to seek other employment. Institutions should ensure supervisors are not only trained but also trusted with decision-making power around flexible work and staff support.
Align flexible work arrangements with employee needs. A persistent disconnect remains between employees’ current and preferred work arrangements, particularly among those in remote-compatible roles. Institutions should work to close this gap by reevaluating rigid on-site policies and expanding remote-work options. Small but strategic changes such as hybrid workdays, summer hours, or allowing employees input in setting their schedules can improve satisfaction and well-being.[45]
Address pay dissatisfaction and fair pay through compensation analyses. Although job satisfaction is the strongest predictor of retention, pay remains the most cited reason employees consider leaving. Just 43% of employees reported receiving a pay increase in the past year, and perceptions of fair pay declined across nearly all groups. Institutions should prioritize regular, transparent, and fair pay increases that outpace inflation and reflect market conditions, especially for lower-paid staff and those in undervalued roles. To strengthen these efforts, institutions should also conduct regular compensation analyses, which can uncover inequities by gender and race/ethnicity, support transparency and accountability, and guide institutions in setting clear goals for inclusion.[46]
Target retention efforts for employees under 45, men, employees of color, and non-supervisors. These groups report lower job satisfaction, higher rates of overwork, and greater intent to leave. Effective retention strategies involve providing targeted support, including career advancement opportunities, flexible scheduling, recognition, and inclusive practices, to address the specific needs of these populations.
Invest in institutional culture, trust, and leadership accountability. Employees’ confidence in their institution’s values, leadership ethics, and commitment to diverse communities are strongly associated with retention. Yet many employees, especially employees of color, report low trust in institutional leadership and limited representation in decision-making roles. Institutions should regularly assess their climate, increase transparency and communication, and ensure that leaders’ responses in times of crisis or uncertainty reflect the inclusive and ethical values of the institution.
Review and refine remote work policies to ensure they are transparent, fair, and responsive to the needs of employees in remote-compatible roles. Establish clear, consistent guidelines for eligibility and expectations, apply them across roles that are remote-compatible, and regularly assess employee feedback. Such practices can reduce dissatisfaction, strengthen trust, and support retention.
Ultimately, the 2025 ERS findings emphasize that retention in higher education is not just about compensation, but also about creating a workplace where employees feel respected, valued, supported, and heard. Institutions that focus their efforts on job satisfaction, supervisor support, fair pay, and inclusive practices will be best positioned to weather continued workforce challenges in the area of retention.
About the Authors:
Jennifer Schneider, Ph.D., is a senior survey researcher at CUPA-HR.
Jacqueline Bichsel, Ph.D., is associate vice president of research at CUPA-HR.
Graphics were created by Kate Roesch, data visualization developer at CUPA-HR.
Citation for This Report:
Schneider, Jennifer & Bichsel, Jacqueline. (2025, September). The CUPA-HR 2025 Higher Education Employee Retention Survey. CUPA-HR. https://www.cupahr.org/resource/higher-ed-employee-retention-survey-findings-september-2025/
Read our full research disclaimer and terms of use.
Bichsel, J., Fuesting, M., Schneider, J., & Tubbs, D. (2022, July). The CUPA-HR 2022 Employee Retention Survey: Initial Results. CUPA-HR.
Bichsel, J., Fuesting, M., Tubbs, D., & Schneider, J. (2023, September). The CUPA-HR 2023 Higher Education Employee Retention Survey. CUPA-HR. This report will reference the 2023 ERS report throughout; subsequent references will not repeat this citation.
CUPA-HR. (2025). Trends in Voluntary Turnover for Staff and Faculty [Annual Workforce Data graphic].
Western Interstate Commission for Higher Education. (2024). Knocking at the College Door: Projections of High School Graduates.
Kelchen, R. (2025, February 28). How Dire is Higher Ed’s Budget Crunch? The Chronicle of Higher Education.
Carillo, S., Turner, C., & Nadworny, E. (2025, July 18). What the ‘One Big Beautiful Bill’ Will Change for Students, Schools, and Colleges. NPR.
CUPA-HR. (2025, July 10). One Big Beautiful Bill Act Signed Into Law With Several HR Policy Changes.
Irwin, V., Wang, K., Jung, J., Kessler, E., Tezil, T., Alhassani, S., Filbey, A., Dilig, R., and Bullock Mann, F. (2024). Report on the Condition of Education 2024 (NCES 2024-144). U.S. Department of Education, National Center for Education Statistics.
Gretzinger, E., Hicks, M., Dutton, C., Smith, J., Cutler, S. & Baiocchi, A. (2025, August 18). Tracking Higher Ed’s Dismantling of DEI. The Chronicle of Higher Education.
Bichsel et al. (2023).
To enhance reach and impact, CUPA-HR partnered with higher ed institutions in the survey dissemination process. Institutions with sufficient response rates received custom reports to benchmark their own data against national trends and inform their retention strategies. To protect respondent anonymity and ensure generalizable results, only institutions with a response rate of at least 10% and a minimum of 50 responses were eligible to purchase a custom report.
A separate faculty version of the Employee Retention Survey (ERS) was also administered in April 2025. Additionally, both the staff and faculty surveys were available in Spanish.
The survey was announced and distributed through individual institutions, CUPA-HR communications, the ERS website, CUPA-HR members, and higher education professional organizations. We thank the CUPA-HR members and other professional organizations that distributed the survey link, as well as the thousands of higher ed employees who took the time to complete the survey. The survey was administered online through Alchemer.
A total of 3,924 people completed the survey; however, 133 respondents were excluded for one or more of the following reasons: they did not list a college or university when asked to provide the name of their employer, they did not list a department/area, or they indicated in a free response that they were faculty or instructors. The data collection period for the 2025 survey was April 1 to April 30, 2025.
Figure 2 shows data for those who answered questions asking for self-identification of gender (96% of respondents) and race/ethnicity (97% of respondents). A nonbinary category was included in the gender item of the survey, but the number of nonbinary employees (n = 65) could not be meaningfully depicted in this intersectional graphic.
Employees of color include those self-identifying as Asian, Black, Hawaiian or Pacific Islander, Hispanic or Latina/o, Native American or Alaskan Native, and those of multiple races.
CUPA-HR. (2025). 2024-25 Administrators, Professionals, and Staff in Higher Education Surveys [Data set].
The department/area in which a respondent worked was self-identified from the following options: academic affairs (academic operations, curriculum, deans, faculty affairs, president/provost, executive assistants); admissions, enrollment, and financial aid; advancement and development (alumni and donor relations, fundraising); athletics; equity and inclusion (diversity, access, compliance, multicultural affairs, Title IX); external affairs (community relations, communications, marketing, media, public relations); facilities, operations, and public safety (maintenance, childcare, custodial, events, environmental health and safety, mail/printing, public safety); fiscal and business affairs (accounting, budget, contracts, grants, payroll, procurement); food services and dining; health, wellness, and counseling; housing and residential services; human resources; information technology; institutional research and effectiveness; legal affairs; library or museum; research and sponsored programs; and student affairs (advising, career services, activities/programs, orientation, campus engagement, tutoring). For reporting purposes, departments/areas with small sample sizes (fewer than 100 respondents) were combined or subsumed under larger departments to provide sufficient sample sizes for reliable comparative analysis. Specifically, health, wellness, and counseling services; athletics; and housing and residential services were all subsumed under student affairs; equity and inclusion was subsumed under human resources; food services and dining was subsumed under facilities, operations, and public safety; library or museum services was subsumed under academic affairs; and both legal affairs and advancement and development were subsumed under external affairs. Institutional research and effectiveness was combined with research and sponsored programs. To allow direct comparison with 2023 results, departments/areas from the 2023 survey were reconfigured using the same structure.
Carnegie Classifications. (2025). Carnegie Classifications of Institutions of Higher Education (2025). American Council on Education.
M = 2.89, SD = 1.39, in 2023; M = 2.55, SD = 1.37, in 2025; t(8,571) = 11.33, p < .001. To aid in interpreting the statistics throughout this report, M denotes the mean, SD denotes standard deviation, and t denotes the statistical test used to determine whether two means are significantly different from one another.
t(3,266) = 8.56, p < .001.
Supervisors: t(3,388) = 2.37, p < .01; Race/Ethnicity: t(819) = 5.48, p < .001. Gender: t(1,787) = 4.42, p < .001.
Respondents who reported they were either very likely, likely, or somewhat likely to look for new work opportunities in the next year were asked to complete this question (n = 1,683). Response options for this question allowed participants to select all that applied.
Respondents reporting they were either very likely, likely, or somewhat likely to look for new work opportunities in the next year were asked to complete this question about the reasons they were seeking new employment opportunities (n = 1,683). Survey respondents were asked to rank the top 3 reasons, from 9 options, that would impact their decision to look for other employment.
Lu, A. (2025, May 25). ‘Every Revenue Source Is at Risk’: Under Trump, Research Universities Are Cutting Back. The Chronicle of Higher Education.
CUPA-HR. (2025). Benefits, Employee Experience, and Structure Survey, 2024-25 [Data set].
The survey included a series of questions about remote work preferences and actual work arrangements. First, respondents were asked to assess whether their job duties could be predominantly conducted remotely, with response options ranging from Strongly Agree to Strongly Disagree. Second, employees were asked about their current work arrangement, with possible responses including: 1) Completely On-Site, 2) Mostly On-Site, 3) Partially On-Site and Partially Remote, 4) Mostly Remote, and 5) Completely Remote. Finally, the survey inquired about preferred work arrangements, providing them with the same response options as the current work arrangement question.
Aksoy, C. G., Barrero, J. M., Bloom, N., Davis, S. J., Dolls, M., & Zarate, P. (2025). Working from Home in 2025: Five Key Facts. Stanford Institute for Economic Policy Research.
Gallup. (2025). State of the Hybrid Workplace: Gallup’s 2025 Indicator on Remote-Capable Workers.
CUPA-HR. (2025). Trends in Voluntary Turnover for Staff and Faculty [Annual Workforce Data graphic].
CUPA-HR. (2025). 2024-25 Benefits, Employee Experience, and Structure in Higher Education Surveys [Data set].
Employee responses were coded on a 5-point scale as follows: Completely On-Site (1), Mostly On-Site (2), Partially On-Site and Partially Remote (3), Mostly Remote (4), and Completely Remote (5).
Respondents were asked to rate their agreement with statements related to overwork. Questions used a five-point Likert scale of agreement (Strongly Disagree, Disagree, Neither Agree nor Disagree, Agree, Strongly Agree).
Agreement percentages in this paragraph reflect the share of employees who selected Agree or Strongly Agree.
Respondents were asked to rate each challenge using a three-point scale: Not challenging, Somewhat challenging, Very challenging.
Respondents were asked to rate their agreement with statements related to their experiences as a supervisor. Questions used a five-point Likert scale of agreement (Strongly Disagree, Disagree, Neither Agree nor Disagree, Agree, Strongly Agree).
The analysis in Table 2 regressed supervisors’ likelihood of looking for other employment onto whether they agree they have adequate management training, resources and support in their supervisory role, power to advocate for their staff, power to allow flexible schedules for their staff, and power to allow their staff to work remotely. The overall model was significant, F(5, 1,288) = 68.89, p < .001, adjusted R2 = .21.
Respondents were asked to rate their agreement with statements related to their work and institutional environment. Questions used a five-point Likert scale of agreement (Strongly Disagree, Disagree, Neither Agree nor Disagree, Agree, Strongly Agree).
Agreement percentages in this section reflect the share of employees who selected Agree or Strongly Agree and disagreement percentages in this section reflect the share of employees who selected Disagree or Strongly Disagree.
There was no significant difference in agreement between men and women on this item.
Questions used a five-point Likert scale of satisfaction (Very Dissatisfied, Dissatisfied, Neither Dissatisfied nor Satisfied, Satisfied, Very Satisfied). Satisfaction percentages in this paragraph reflect the share of employees who selected Satisfied or Very Satisfied and dissatisfaction percentages in this paragraph reflect the share who selected Dissatisfied or Very Dissatisfied.
Respondents were asked to select which, if any, retention-related incentives they received in the past year from a list of options. Multiple responses were allowed.
Principal components analysis using SPSS with Varimax rotation.
An initial analysis revealed that both age and perception of fair pay did not “hang” well with any of the factors and should be considered individually in predictions of retention. In addition, years in position and number of additional hours worked were not included because of their relatively low correlations with the likelihood of looking for other employment.
Bloom, N., Han, R. & Liang, J. (2024). Hybrid Working From Home Improves Retention Without Damaging Performance. Nature, 630, 920–925.
For comprehensive salary information, institutions can use CUPA-HR’s DataOnDemand, which enables benchmarking against peer institutions and national standards and can be used to conduct internal compensation analyses.