
By Jingyun Li, Jasper McChesney, and Jacqueline Bichsel | February 2019
Introduction
Many colleges and universities continue to face significant fiscal challenges since the 2008 recession. Two major revenue sources on which institutions rely — federal research grants and state funding — have declined over the past decade. Federal support for research flattened in 2005 and dropped by 23% between 2009 and 2015.[1] State funding for public colleges is nearly $9 billion below its 2008 level (16% less per student than it was in 2008).[2] In addition, retirement and healthcare costs continue to drive up the cost of higher education and compete with education for limited state funding, making the financial future of higher education in the U.S. uncertain.[3]
Decline in government support contributed to increased tuition over the past decade. From the 2007-08 academic year to 2017-18, tuition and fees rose by 65% at four-year public colleges and by 49% at private colleges.[4] Institutions are relying more than ever on tuition dollars (Figure 1).[5] Over the past 10 years, many colleges and universities also cut positions, eliminated course offerings, closed campuses, and/or shrank student services.[6]
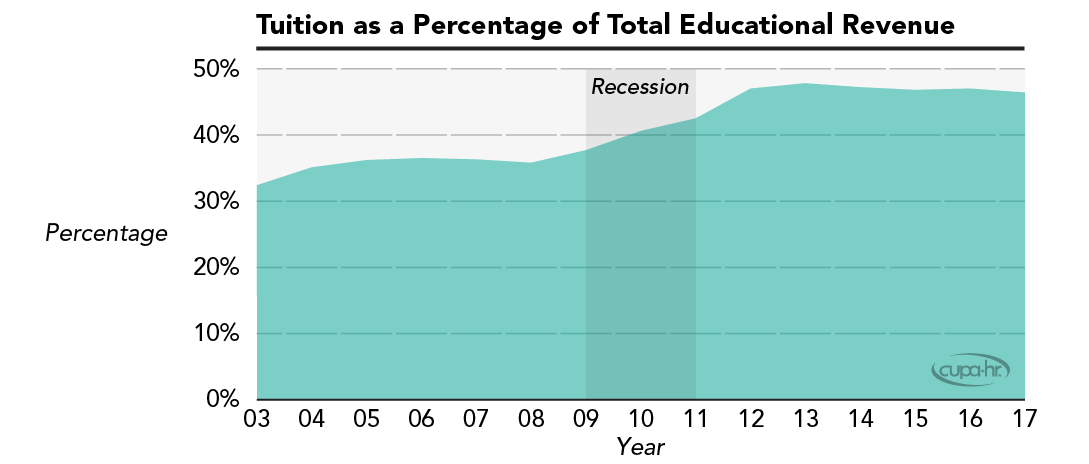
Figure 1. Tuition as a Percentage of Total Educational Revenue
Instruction, including faculty salaries and benefits, is the largest expenditure category at both public and private nonprofit higher education institutions, accounting for approximately one-third of total expenses at public and private nonprofit institutions in 2015-16.[7] To cope with the financial challenges since the recession, many higher ed institutions have adjusted the size and composition of their faculty or slowed down hiring to save on costs.
To assess the potential impact this financial pressure has had on higher ed institutions in the last decade, this report evaluates trends in student enrollment, faculty size relative to enrollment, faculty composition, and new faculty hires in the U.S. between 2003 and 2018 by analyzing 599 four-year higher education institutions that participated in CUPA-HR surveys every year during this period.[8] Figure 2 summarizes the characteristics of these participating institutions. These 599 institutions represent 39% of U.S. four-year institutions.[9]
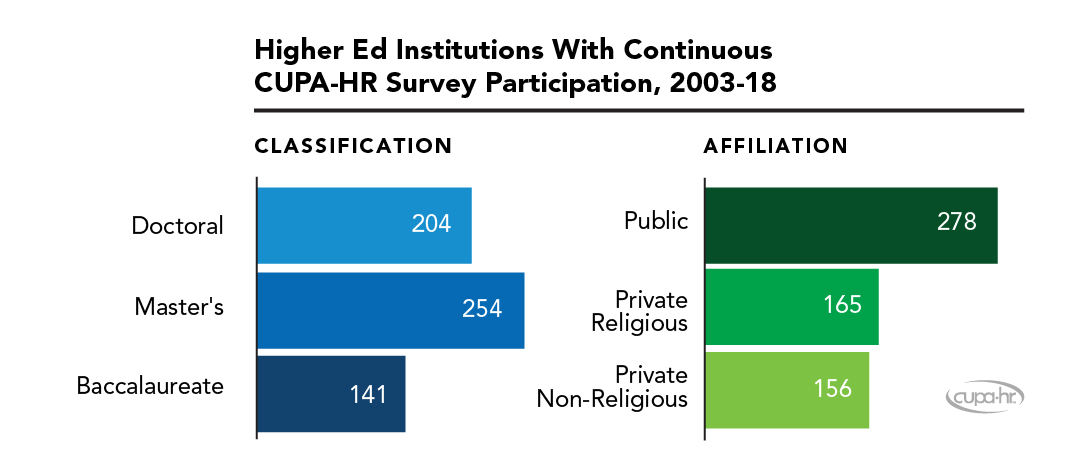
Figure 2. Higher Ed Institutions With Continuous CUPA-HR Survey Participation, 2003-18
Student Enrollment
Individuals weigh the costs and benefits in deciding whether to enroll in college and pursue a degree. This includes consideration of the costs of education at a private institution (typically higher cost) vs. a public institution (typically lower cost). We assessed the impact of the recession on student enrollment patterns at different types of institutions. Figure 3 shows the median percentage change from the previous year in student enrollment from 2004 to 2018. For example, the median percentage change in student enrollment from 2003 to 2004 is denoted as “04.” If the median percentage change is greater than 0, it means more than half of institutions increased in student size that year.
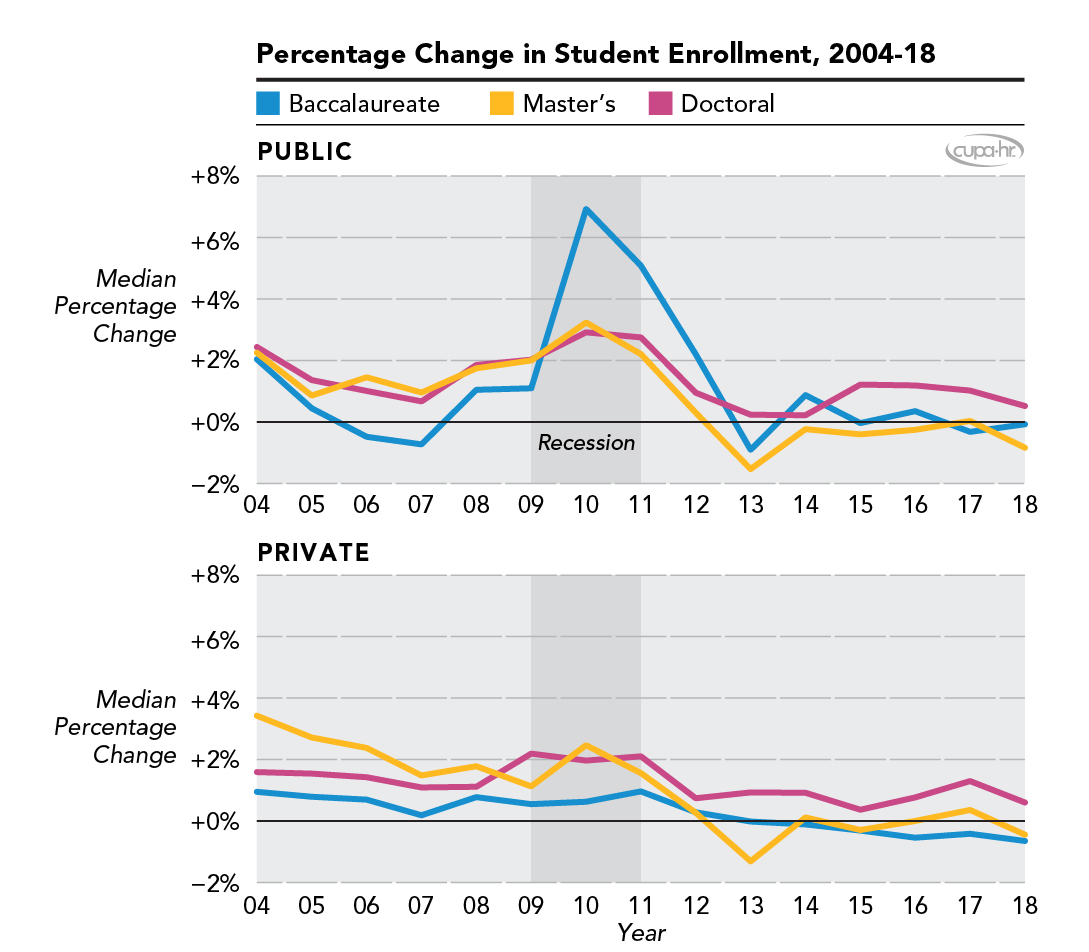
Figure 3. Percentage Change in Student Enrollment, 2004-18
Prior to 2007, nearly all types of institutions were experiencing downward trends in student enrollment change, although for the most part enrollment was still increasing slightly each year. During the economic downturn, institutions — particularly public ones — saw a spike in enrollment increases. Especially pronounced was the spike in enrollment at public baccalaureate institutions, which saw a median 7% increase in student enrollment in 2010 and a 5% increase in 2011. After the spikes, however, institutions experienced a precipitous decrease in enrollment change. For all but doctoral institutions, enrollment decreased by up to 1.5% in 2013. This was followed by a slight increase and stabilization in enrollment for most institutions from 2014 to 2018 (except for private baccalaureate institutions, which have continued to experience decreases in enrollment). In the past year, all but public baccalaureate institutions have experienced declines in percentage enrollment change, bringing them all at or near the zero-growth mark.
These data support previous findings that individuals are more likely to attend college during an economic recession.[10] In addition, given that those impacted most by the recession are those without a college degree, it makes sense that the largest spike in enrollment occurred at more affordable public baccalaureate institutions. What we can also note from this data, though, is that the spike occurred when college was more affordable — in other words, before institutions increased tuition to combat the budget cuts in response to the recession. When tuition increased, institutions experienced a decline in enrollment. For public institutions, which increased tuition the most, the decline was the most precipitous.
Faculty Size Relative to Enrollment
Reducing faculty size relative to enrollment is an obvious way to save on costs. When faculty members assume heavier teaching loads and/or additional research responsibility, institutions can freeze or reduce hiring and reduce spending on faculty salaries while increasing revenues through tuition. However, this adjustment may reduce the level of interaction faculty have with students and decrease research productivity, negatively impacting the quality of education and the institution’s reputation. Decreasing faculty-student ratios is a gamble, as faculty-student engagement has been found to be a strong factor in predicting the long-term success and well-being of college students.[11]
Figure 4 shows the number of full-time equivalent (FTE) faculty per 100 FTE students by institution classification and affiliation.[12] Faculty-student ratios have historically been substantially higher in private institutions than in public ones, and we see this definitively in our data (Figure 4). Private non-religious baccalaureate institutions in particular had the highest faculty-student ratio among all types of institutions for the entire period displayed, 2003 to 2018. Also depicted in the graph are the differences in post-recession response in regard to faculty-student ratio. For public institutions, the response was to decrease the number of faculty they retained or hired in proportion to their student size, and recovery of pre-recession faculty-student ratios has been slow. Most private institutions were able to maintain or even slightly increase their faculty-student ratio during the recession. For those private institutions that did show a slight decrease during the recession, recovery of their faculty-student ratios was rapid, and they have been increasing steadily ever since.
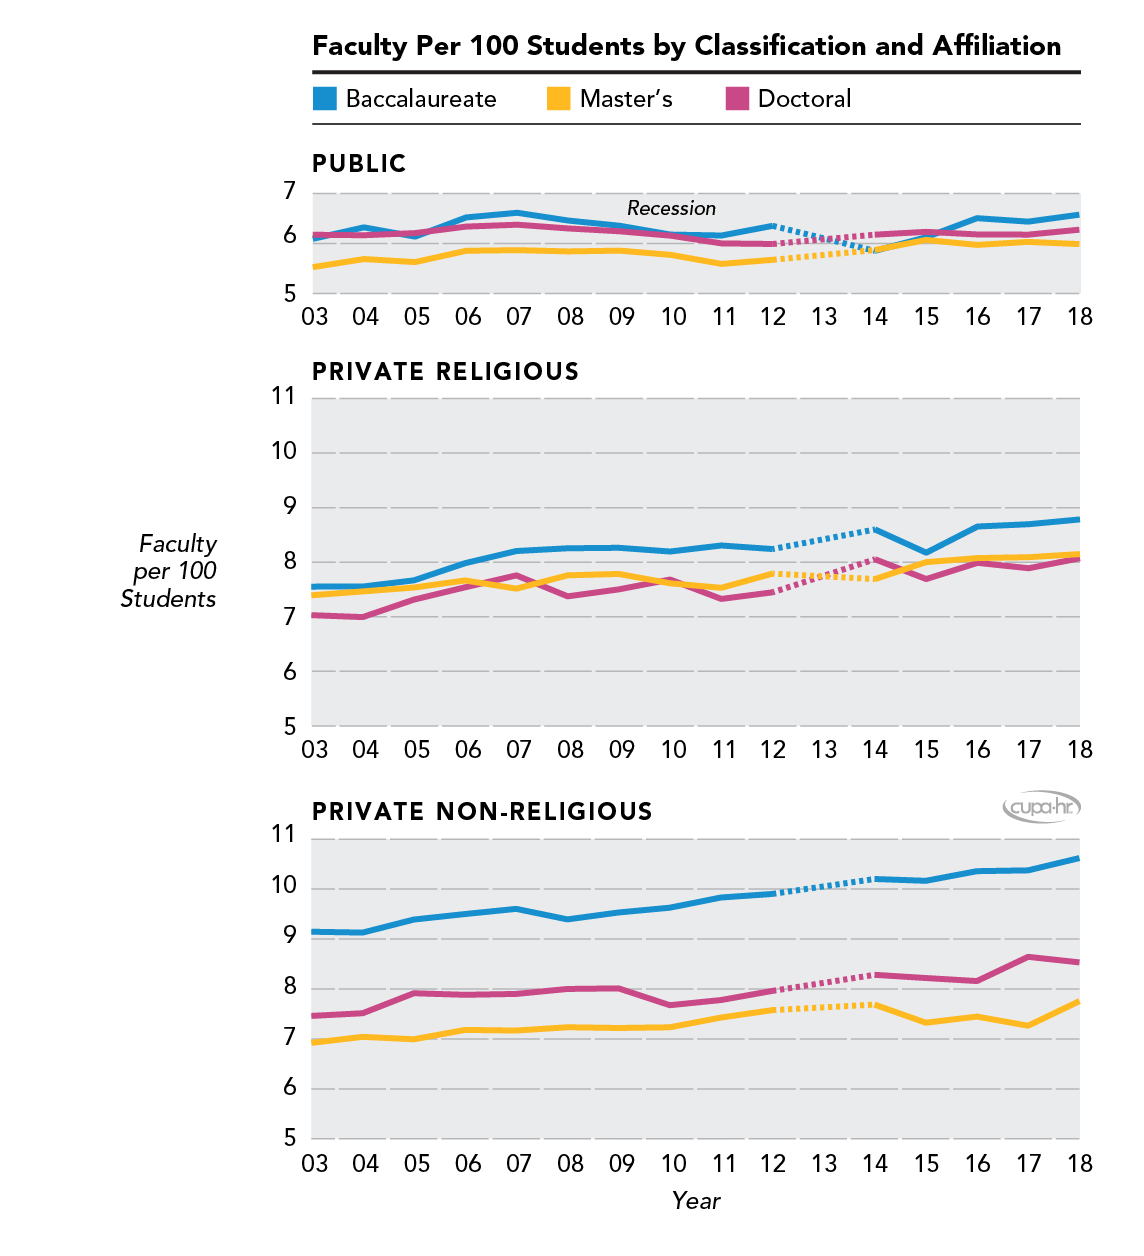
Figure 4. Faculty Per 100 Students by Classification and Affiliation
Faculty Composition
Since different types of faculty are compensated differently, adjusting faculty composition directly impacts the bottom line. Full-time (FT) faculty usually include tenure-track (TT) and non-tenure-track (NTT) faculty. TT faculty are typically paid more than their NTT counterparts. The median salary for a TT faculty member is $78,848.[13] NTT faculty make about 20% less than TT faculty: NTT teaching faculty earn a median salary of $59,739, and NTT research faculty earn a median salary of $60,004.[14] Part-time (PT) faculty are typically paid the least — the median pay for a PT faculty member is $993 per semester credit hour taught.[15] Supposing a PT faculty member teaches five three-credit-hour courses per semester (considered a full-time load), the median salary would be $29,790 per year, which is significantly less than the salary for a FT faculty member.[16]
Therefore, another strategy an institution can employ to decrease costs is to adjust the composition of the faculty by increasing the number of PT faculty.[17] In addition to making lower salaries, PT faculty usually do not receive benefits.[18] Also, the level of support they receive is very different from FT faculty, which can affect their involvement in student learning. For example, many PT faculty are not granted office space, which leaves students without instructors available for office hours.[19] As is the case with reducing faculty size in general, increasing the number of PT faculty as a strategy to decrease costs is also a gamble, as having a greater percentage of PT faculty has been shown to negatively impact the quality of education.[20]
Figure 5 shows the median percentage of PT faculty within the total faculty between 2003 and 2018 by institution classification and affiliation.[21]
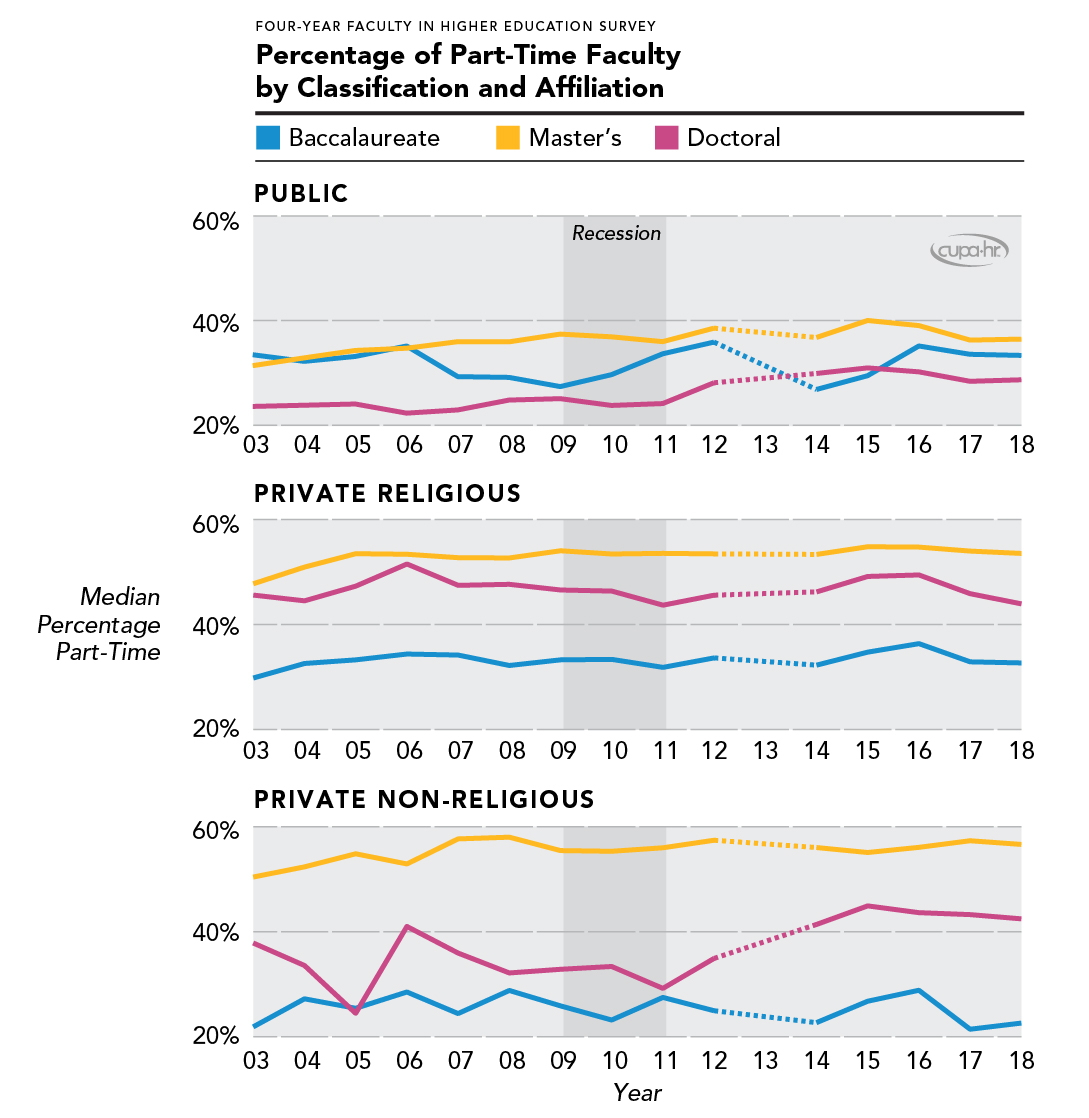
Figure 5. Percentage of Part-Time Faculty by Classification and Affiliation
Although the data within some institution types is highly variable, there are some trends we can note. First, baccalaureate institutions — particularly private ones — have maintained a fairly steady and relatively low percentage of PT faculty since 2003. Even public baccalaureate institutions have about the same level now as they did in 2003, despite some variability in between. Therefore, we can conclude that baccalaureate institutions generally did not respond to recession budget cuts by replacing FT faculty with PT ones. Master’s institutions — particularly private ones — have the highest percentage of PT faculty. In fact, more than half of faculty at private master’s institutions are part-time. Master’s institutions had been increasing their proportion of PT faculty even before the recession hit, so their relatively high proportion of PT faculty cannot be attributed exclusively to recession budget cuts. Doctoral institutions’ PT faculty percentage differs over time by their affiliation. Although private religious doctorals did not respond to the recession by replacing FT with PT faculty, private non-religious doctorals did and now have a greater percentage of PT faculty than they did in 2003. Public doctorals also appeared to increase the utilization of PT faculty after the recession, a progressive trend sustained since that time.
Total Expenses
It may be the case that the level of an institution’s use of PT faculty is determined by its financial status (as measured by total expenses). Institutions with greater resources might choose to hire more FT faculty, whereas those with fewer resources might choose to hire more PT faculty. Therefore, we looked at faculty composition (FT tenure-track, FT non-tenure-track, PT) by total expense quartile and classification in our most current (2018) data (Figure 6).[22]
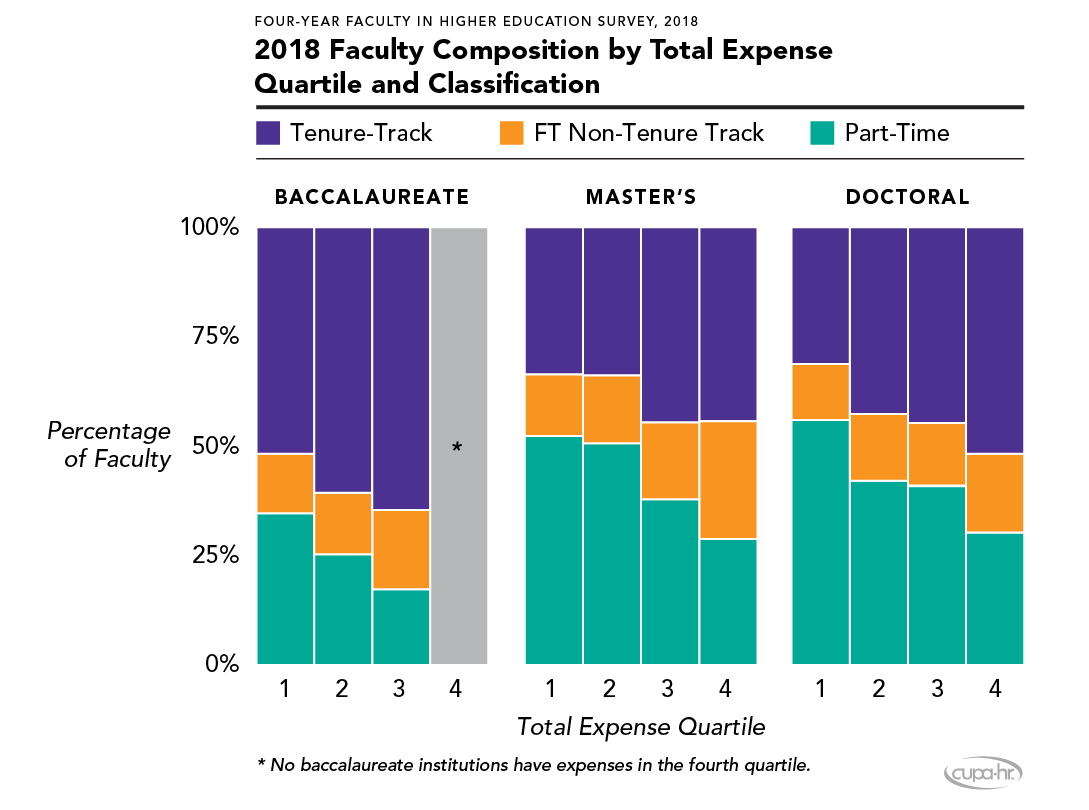
Figure 6. 2018 Faculty Composition by Total Expense Quartile and Classification
In general, institutions with lower total expenses hire the most PT faculty and the fewest tenure-track faculty proportionally. However, although baccalaureate institutions have lower total expenses overall, they hire many more TT faculty relative to PT faculty than do either master’s or doctoral institutions. Even those in the lowest financial quartile (Q1) have a faculty that is half tenure-track, compared to Q1 master’s and doctoral institutions, in which only about one third of the faculty are tenure-track. This is an interesting finding given that the primary mission of baccalaureate institutions is teaching. It would have been an easy solution for baccalaureate institutions to respond to the recession by replacing FT faculty with PT faculty; however, our data show that they have maintained a fairly steady and relatively low proportion of PT faculty.
New Assistant Professor Hires
Another possible response to budget cuts is to freeze new full-time faculty hires. Figure 7 shows the number of new assistant professors hired from 2004 to 2018 by institution classification and affiliation.[23]
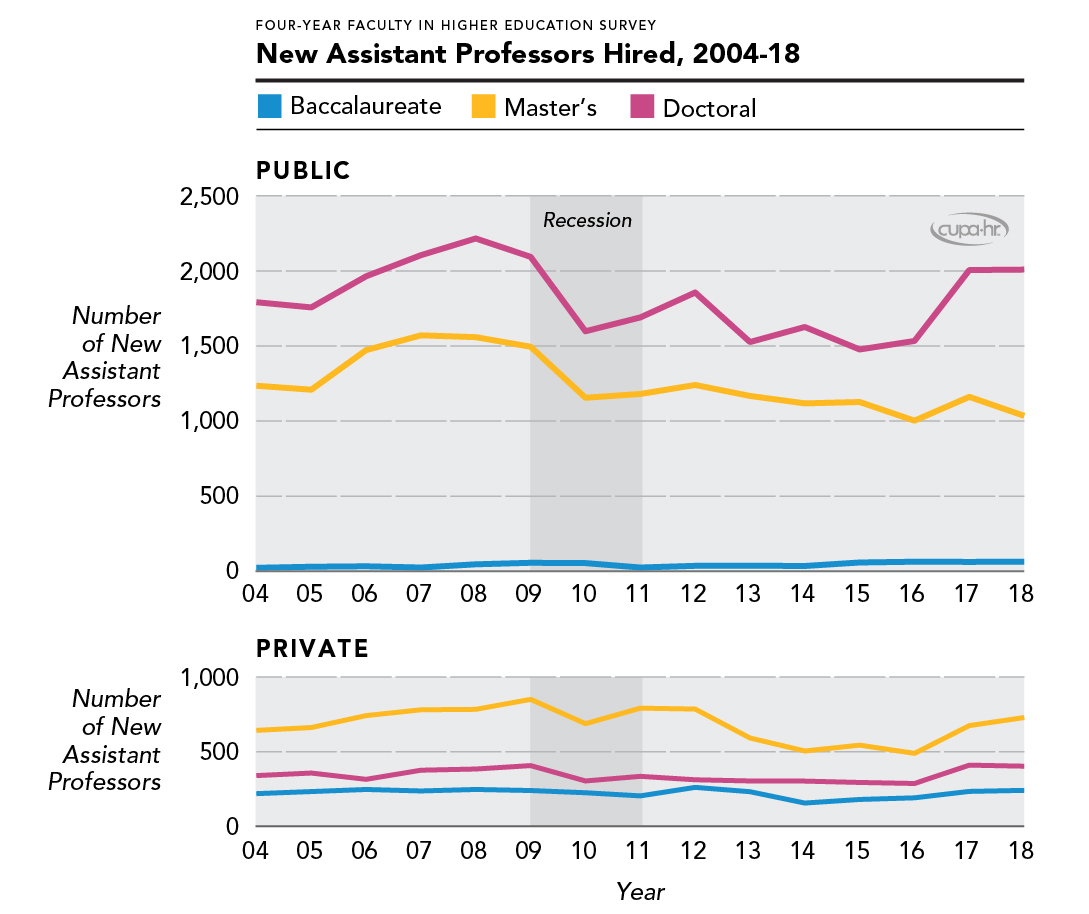
Figure 7. New Assistant Professors Hired, 2004-18
Prior to 2008, new hires of full-time faculty were rapidly growing at master’s and doctoral institutions. After the recession, there was a notable decline in new assistant professor hires, and this decline continued until 2016, when institutions began to increase new hires, suggesting this may have been the point of recovery. In contrast, new assistant professor hires at baccalaureate institutions remained relatively steady (and low) over this entire period.
The impact of the recession was not the same for all academic disciplines, however. The three disciplines that had the most hiring growth from 2004 to 2018 were health-related professions, engineering, and business. In contrast, the three disciplines with the largest hiring decrease over the same time period were foreign languages/literatures, social sciences, and English language/literature (Figure 8). These trends in faculty hiring by discipline mirror increased student enrollment in these disciplines.
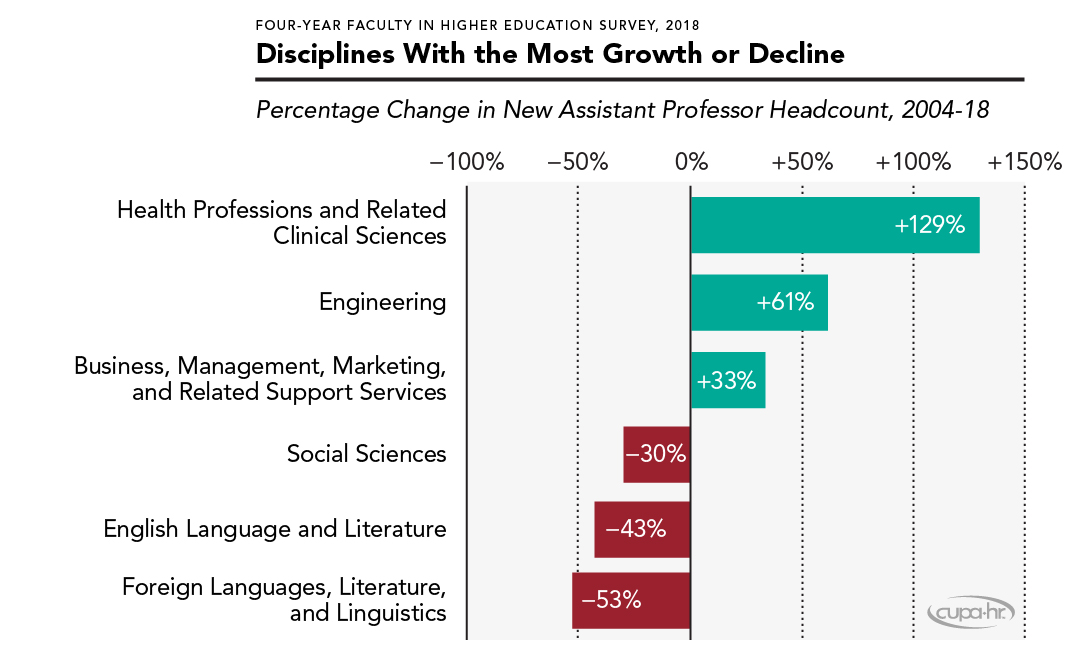
Figure 8. Disciplines With the Most Growth or Decline
Conclusions
The 2008 economic recession had profound impacts on both students and faculty in higher education. The results of this report suggest that the overall impact of the economic recession on college student enrollment was positive during the recession. Student enrollment increased during the recession at all types of institutions. The largest percentage increase occurred at public baccalaureate institutions in 2010. After the spikes, however, institutions experienced a decrease in enrollment change in 2012 and 2013. For all but doctoral institutions, these decreases resulted in a period of negative enrollment change post-recession.
Different types of institutions responded to the economic recession differently. Public institutions — which were more affected by decreases in government support — hired fewer new full-time faculty and more part-time faculty to handle increased student enrollment, and public doctoral institutions have continued to increase the utilization of part-time faculty post-recession. The ratio of full-time faculty to students in public institutions has remained relatively unchanged. On the other hand, private institutions — less reliant on state and federal support — increased their full-time faculty-student ratio from 2003 to 2018. Private baccalaureate and master’s institutions have maintained a steady percentage of part-time faculty post-recession.
The recession slowed down the hiring of new full-time faculty at all types of institutions. Prior to 2008, the number of newly hired assistant professors was growing each year for all institution types. This trend stopped during the recession, and a decline in new assistant professor hires continued until 2016, when institutions increased the number of new hires. Disciplines that saw the most growth in new hires were health-related professions, business, and engineering. In contrast, the disciplines that saw the greatest decline in new hires were foreign languages/literature, social sciences, and English language/literature.
This report provides a broad national overview of the impacts of the economic recession on higher education. We hope that institution leaders will use this report as a planning resource. Understanding the impact of the recession as well as recovery patterns at different types of institutions may help colleges and universities better position themselves to address the challenges brought by future economic recessions, budget cuts, and shifts in enrollment.
Citation for this report:
Li, Jingyun; McChesney, Jasper; & Bichsel, Jacqueline (2019, February). Impact of the Economic Recession on Student Enrollment and Faculty Composition in U.S. Higher Education: 2003-2018 (Research Report). CUPA-HR. https://www.cupahr.org/resource/2018-impact-of-the-economic-recession/
Read our full research disclaimer and terms of use.
Calculated using data compiled by the American Association for the Advancement of Science.
Mitchell, M.; Leachman, M.; & Masterson, K. (2017, August). A Lost Decade in Higher Education Funding: State Cuts Have Driven Up Tuition and Reduced Quality (Research Report). Center on Budget and Policy Priorities.
Auter. (2017, December). What Gallup Learned About Higher Education in 2017 (Blog Post). Gallup.
Powell. (2017, September 20). In-State Tuition Increases Sharply at Some Public Schools. U.S. News & World Report.
Data available from State Higher Education Executive Officers. Year in Figure 1 refers to fiscal year, which starts July 1 and runs through June 30 of the following calendar For example, fiscal year 2009 ran from July 2008 through June 2009.
Mitchell et al., 2017.
Other categories include: a) student services, academic support, and institutional support; and b) research and public service. U.S. Department of Education, National Center for Education Statistics (2018, May). Postsecondary Institution Expenses. The Condition of Education 2018 (NCES 2018- 144).
Associate’s institutions were not included, as their participation history was not consistent. Data were collected as part of CUPA-HR’s surveys of administrators, professionals, staff, and faculty in higher education from 2003-18. In this report, “year” refers to the year the academic year ends. For example, 2003 designates academic year 2002-03, and 2018 designates academic year 2017-18.
Excluding special focus and for-profit.
Dellas, H., & Sakellaris, P. (2003). On the Cyclicality of Schooling: Theory and Evidence. Oxford Economic Papers, 55, 148-172.
(2014). The 2014 Gallup-Purdue Index Report (Research Report).
FTE faculty refers to both tenure-track and non-tenure-track faculty. Most institutions calculated their FTE for faculty and students and reported to CUPA-HR. If not reported, FTE for faculty is calculated as the number of full-time faculty plus one-third of part-time faculty. FTE for students is calculated in the same 2013 data were not included due to a change in survey questions in that year that makes comparisons incompatible.
CUPA-HR. (2018). Faculty in Higher Education Survey.
Ibid.
Ibid.
Summer wages are not included in any salary comparisons.
Part-time faculty are often referred to as adjunct faculty or faculty paid-by-the-course. It is acknowledged that use of these terms may or may not be interchangeable at some.
Only 35% of institutions offered healthcare benefits to part-time faculty in 2017. CUPA-HR. (2018). Benefits in Higher Education Survey.
Kezar, A.; Scott, D.; & Yang, H. (2018, January). The Faculty of the Future (Opinion). Inside Higher Ed.
Ginsberg, B. (2012, May). Tenure and Academic Freedom: The Beginning of the End (Opinion). Academic Matters.
2013 data were not included for this analysis due to a survey question that was changed in that year, making the data incomparable.
Institutions in the first expense quartile (Q1) are institutions with total expenses reported to IPEDS in the 2017 Spring Finance Survey of less than 74 million; Q2 institutions have total expenses greater than 74 million but less than 142 million; Q3 is greater than 142 million but less than 357 million; and Q4 is greater than 357 million. Note: No baccalaureate institutions have total expenses in Q4.
2004 is the first year CUPA-HR started to collect data consistently on 32 broad disciplines defined by 2-digt CIP codes developed by the U.S. Department of Education. New assistant professors include all full-time new assistant professors who were hired in the beginning of that academic year, regardless of tenure status (tenure-track or non-tenure-track). Unlike the other data points in this report that come from the Institutional Basics section common to all our surveys, the analysis of the number of newly hired assistant professors includes 298 institutions that participated in the CUPA- HR Faculty Survey each year from 2003 to 2018.