
By Diana Tubbs | April 2026
Introduction
Business and finance employees are essential to higher education, safeguarding the financial health and operational efficiency vital to long-term success. Through responsible financial management and adherence to regulatory standards, these teams provide the support necessary for the campus community to focus on their best work.
Higher education is facing a period of significant uncertainty, placing unprecedented pressure on business and finance teams. The combination of shifting enrollment demographics,[1] increased pressure on tuition revenue, policy disruptions, and rising costs has transformed the fiscal landscape, presenting this workforce with particularly demanding challenges.[2]
Despite their critical role, there is limited research focused on the business and finance workforce in higher education. Although there is strong coverage of institutional finance, far less is known about the people who carry out this work.[3] Drawing on data from CUPA-HR’s higher education workforce surveys,[4] this report provides a comprehensive analysis of the size, structure, and most common positions within the business and finance workforce. In this report, we examine employees across three distinct levels — non-supervisors, supervisors, and administrators.
Key findings detailed in this report include a comparative analysis of median pay across associate’s, baccalaureate, master’s, and doctoral institutions. Additionally, the report examines representation and median pay ratios by race/ethnicity and gender — noting that women have substantial representation in business and finance roles. The findings also provide a unique intersectional lens on pay equity, identifying disparities for women based on both age and position level — data points often overlooked in previous research.[5] Furthermore, the report explores years in position, revealing important differences in how long employees remain in non-supervisory, supervisory, and administrative roles. Finally, insights from CUPA-HR’s Higher Education Employee Retention Survey highlight that although business and finance employees report a lower likelihood of seeking other job opportunities, there is a clear gap between the flexible work arrangements employees desire and current workplace offerings.[6]
The report concludes with evidence-based recommendations for benchmarking the size and structure of the business and finance workforce, developing leadership and development opportunities, and addressing gaps in pay equity.
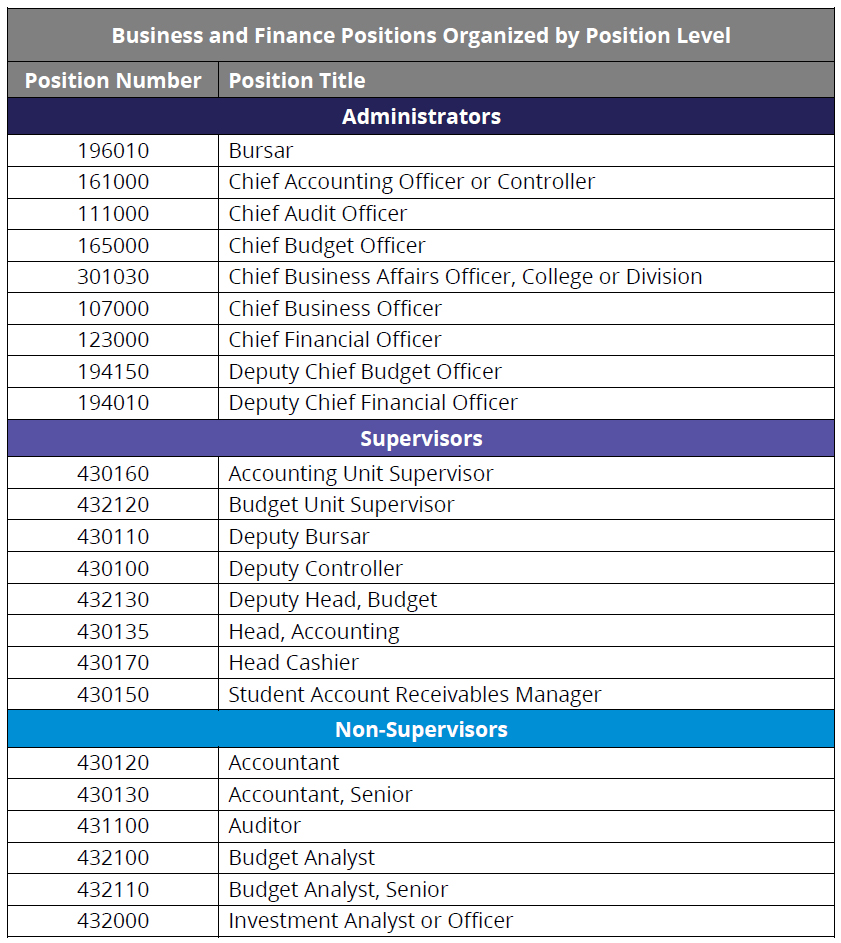
Business and Finance Positions in Higher Ed
This report focuses on the positions responsible for business and financial affairs in higher ed institutions, including investments, accounting, auditing, budgeting, payroll, cashiering, and student bill payments. Table 1 shows the 23 business and finance positions included in this report organized by administrators, supervisors, and non-supervisors. Administrator-level positions oversee and direct large units, such as accounting, business affairs, and finance. Supervisor-level positions serve as the direct point of contact between employees and administrators. Supervisors manage frontline workers and ensure that functions are completed, productivity is maintained, and policies are enforced. Non-supervisor positions focus primarily on individual functions and responsibilities. A few examples of these functions are providing analytic support for budget projects; performing financial, operational, and compliance audits; and reviewing and analyzing the institution’s investment portfolio.[7] In 2024-25, 19,237 business and finance employees were reported across 1,006 institutions in CUPA-HR’s higher ed workforce surveys.[8] Among these business and finance employees, 22% were administrators, 20% were supervisors, and 57% were non-supervisors. These proportional differences are expected because, depending on the size of an institution, supervisors commonly oversee two to 10 employees in non-supervisor roles, and administrators may have multiple supervisors report to them.
Table 1. Business and Finance Positions Organized by Position Level
Workforce Size, Most Common Positions, and Median Pay
Doctoral Institutions Have the Largest Business and Finance Workforces
Workforce size was analyzed to assess differences in staffing levels among associate’s, baccalaureate, master’s, and doctoral institutions. Figure 1 shows the median number of employees in business and finance positions by institution classification.[9] Overall, the median number of employees increases modestly across associate’s (median n = 5), baccalaureate (6), and master’s (7) institutions, followed by a substantial jump at doctoral institutions (16). In addition, the workforce size ranges (25th to 75th percentile) show considerable overlap for associate’s (2-8), baccalaureate (4-9), and master’s (4-10) institutions. In contrast, doctoral institutions exhibit a much wider range in workforce size, spanning from 8 (25th percentile) to 36 (75th percentile) employees.[10]
These results suggest that business and finance workforce sizes are generally similar among associate’s, baccalaureate, and master’s institutions. However, doctoral institutions have substantially larger business and finance workforces — approximately two times the size of non-doctoral institutions — with considerable variability.
Figure 1. Median Number of Business and Finance Employees by Classification
Doctoral Institutions Not Only Have More Employees, They Also Have More Business and Finance Roles
The most common business and finance positions were identified to characterize typical staffing patterns by institution classification.[11] Figure 2 presents these positions along with the median number of employees in each.
Overall, staffing patterns show greater role concentration in associate’s, baccalaureate, and master’s institutions, and extensive role differentiation in doctoral institutions. Associate’s institutions have four common positions, primarily administrative roles (three positions with one employee in each) and a single non-supervisor position staffed by two employees. Baccalaureate institutions have five common positions, including two administrative and one supervisor role (one employee in each position), along with two non-supervisor roles, each with one employee. Master’s institutions have six common positions, consisting of four administrative roles (one employee in each position) and two non-supervisor roles, each with one to two employees. The comparatively compact staffing patterns observed in non-doctoral institutions may reflect their teaching-focused mission, smaller operating budgets, and limited external funding, which likely contribute to smaller, more concentrated business and finance teams.
At doctoral institutions, it is common to see five administrative roles (one employee in each position), two supervisor roles (one to two employees in each position), and four non-supervisor roles (two to four employees in each position). This staffing pattern illustrates a decentralized workforce, where administrators oversee larger units that rely on multiple supervisors, each with several direct reports, to manage the institution’s extensive financial operations. Doctoral institutions are characterized by their vast research operations and complex organizational structures. Their business and finance functions encompass responsibilities more likely to exist in these environments, such as grant accountants, budget analysts for labs, and even finances for auxiliary units such as athletic departments and technology centers.
Figure 2. Most Common Business and Finance Positions by Classification
Doctoral Institutions Pay the Highest Salaries, Especially to Supervisors and Administrators
Figure 3 shows the median salary for each position level and institution classification. Across all three position levels, doctoral institutions pay the highest median salaries; however, their competitive edge in pay stands out most for supervisors and administrators. On median, doctoral institutions pay non-supervisors 3.4% more than baccalaureate institutions, the next-highest paying category. In comparison, doctoral institutions pay supervisors 18% more and administrators 20% more than the next-highest paying categories — associate’s and baccalaureate, respectively. Higher salaries at doctoral institutions are likely a reflection of larger operating budgets and the specialized expertise required for business and finance roles, including managing larger teams, overseeing complex financial operations, ensuring regulatory compliance, and mitigating elevated institutional risk.[12] These unique skills also position business and finance employees to compete for higher-paying opportunities outside of higher education, increasing market pressure on institutions. This pattern extends beyond business and finance; prior research has shown that doctoral institutions also provide higher median pay for admissions positions.[13]
Figure 3. Median Salaries by Position Level and Classification
Representation and Pay Equity
Women Are Well Represented in Business and Finance Positions, But Representation of Administrators of Color Lags Behind
Figure 4 shows the composition of business and finance employees by gender, race/ethnicity, and position level. To evaluate representation, we compared supervisors and non-supervisors to the national pool of bachelor’s degree holders, whereas administrators were compared to the national pool of master’s degree holders. These cohorts serve as a proxy for the qualified workforce for these positions, as they reflect the standard minimal educational requirements for their respective roles.
Women have good representation across all three levels of business and finance positions. Among both supervisors and non-supervisors, women have 75% representation, substantially exceeding the 52% of women in the U.S. who hold bachelor’s degrees. Furthermore, a supplemental analysis revealed that this 75% figure is notably higher than the 61% representation of women across all higher ed roles that require professional-level expertise.[14]
Among administrators, women have 61% representation, surpassing the 54% of women in the U.S. who hold a graduate degree.[15] A supplemental analysis found that this 61% figure also exceeds the 54% representation of women found across all higher ed administrator roles.[16]
A different pattern exists in the representation data for business and finance employees of color. In roles with increased levels of supervisory status and administrative oversight, fewer employees of color are represented.[17] Among non-supervisors, people of color have 31% representation, which is similar to the 32% of people of color in the U.S. who hold bachelor’s degrees. In comparison, supervisors of color have 24% representation, which falls short of the same baseline of bachelor’s degree holders (32%). Finally, employees of color represent 17% of administrator roles, which is substantially lower than the 32% of people of color in the U.S. who hold a graduate degree.
These findings are important for a few reasons. First, there is a wealth of data showing that the perspectives of women and people of color strengthen problem-solving approaches by providing a broad range of insights that mitigate risk and drive financial performance.[18] Second, employees’ satisfaction with their work environment is influenced by whether leadership reflects a variety of backgrounds.[19] When leadership does not reflect a variety of backgrounds, employees of color report more negative perceptions of workplace climate.[20]
Figure 4. Composition of Business and Finance Employees by Gender and Race/Ethnicity
Female Administrators Face the Largest Pay Gaps
Figure 5 shows the median pay ratios for business and finance employees by gender, race/ethnicity, and position level.[21] Among non-supervisors, women of all races/ethnicities are paid less than their male counterparts. Black, Hispanic/Latina, and White women are paid $0.97-$0.98 for every dollar White men are paid. Asian women are paid more ($1.01) than White men, but less than Asian men ($1.08). Men across all racial/ethnic groups are paid more than White men, with Asian men being paid the most. This pattern shows that men are consistently paid at higher rates than their female counterparts in non-supervisor roles.
Among supervisors, women across all racial/ethnic groups are paid less than White men in the same positions.[22] Black women have the lowest median pay ratios at $0.90 for every dollar White men are paid. These data reveal larger pay gaps for women of all races/ethnicities in supervisory positions compared with non-supervisory roles. Among administrators, all racial/ethnic groups are paid less than White men except for Asian men and women. Women’s pay ratios are the lowest for White and Hispanic/Latina administrators, as they are paid $0.84 and $0.85, respectively, for every dollar White men are paid. These pay ratios are the lowest for any intersectional group across all three position levels (non-supervisors, supervisors, and administrators) and show even greater pay inequities for women in administrative roles compared to supervisors.
Figure 5. Median Pay Ratios for Business and Finance Employees by Gender and Race/Ethnicity
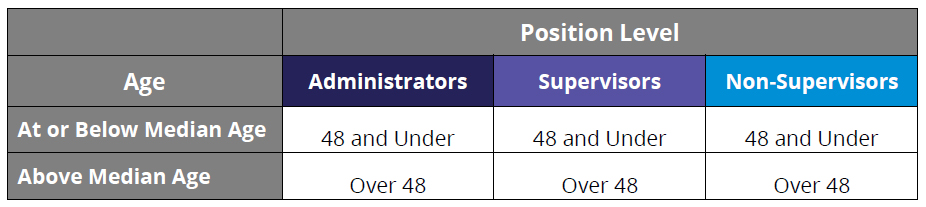
Female Administrators Over the Age of 48 Experience the Most Substantial Pay Inequity
To analyze the impact of age on the gender pay gap, we examined pay data for business and finance employees above and below the median age of 48 at each position level. This process yielded six distinct groupings, as shown in Table 2. For each of the six groups, the median pay for women was divided by the median pay of their White male counterparts in the same age and position level.[23] These calculations resulted in median pay ratios for women by age and position level as show in Figure 6.
Table 2. Younger and Older Age Grouping Organized by Position Level
The findings show pay disparities for women across all six groups; women are paid less than their White male counterparts, regardless of age or position level. The disparity was most pronounced among administrators: women over the age of 48 are paid $0.82 for every dollar paid to White men in the same age group, whereas women 48 and under are paid $0.97 for every dollar paid to their White male peers. Notably, female administrators over 48 exhibit the lowest pay ratio of any group analyzed.[24] In practical terms, the $0.82 to $1.00 ratio translates to a gap of more than $30,000 in annual salary.[25] This substantial disparity in salary creates a compounding effect, as lower annual earnings directly reduce a woman’s ability for lifetime savings and the long-term accumulation of retirement wealth.[26]
A similar pattern is observed among non-supervisors, where women over 48 are also paid less equitably compared to women 48 and under in the same roles. Female non-supervisors over 48 are paid $0.94 for every dollar paid to White men in the same age group, whereas women 48 and under are paid $0.97 for every dollar paid to their White male peers.
In contrast, among supervisors, women 48 and under are paid less equitably compared to women over 48 years old in the same roles. Female supervisors who are 48 and under are paid $0.92 for every dollar paid to White men in the same age group, whereas female supervisors over 48 are paid $0.94 for every dollar paid to their White male peers. However, a key point here is that women’s pay ratios at the supervisor level are lower than those at the non-supervisor levels, showing larger pay gaps for women in higher-level leadership roles.
Figure 6. Median Pay Ratios for Women by Age and Position Level
Years in Position
Administrators Have the Longest Tenure Among Business and Finance Employees
The number of years business and finance employees have been in their roles was examined.[27] Figure 7 shows the median years in position for each business and finance position.[28] Overall, administrators have the longest tenure with six out of nine positions having a median of at least 4 years in position. Bursars and chief audit officers stand out with the longest tenure, each with a median of 5 years in position. Extended tenure can be a strategic asset for institutions. In allowing for the accumulation of deep institutional knowledge and social capital, employees with longer tenures ensure the stability required to execute complex strategic initiatives.[29]
Among supervisors, heads of accounting also have a median of 5 years in position. In comparison, all other business and finance supervisor positions have a median of 3 years in position, suggesting that heads of accounting tend to remain in their roles noticeably longer. Although a two-year difference in median tenure may appear small, it is substantial.[30] Unlike an average, the median is resistant to outliers; therefore, a two-year increase indicates a systemic difference rather than the outsized influence of a few long-tenured individuals.
Among non-supervisors, senior accountants have the longest tenure with a median of 3 years in position. This stands in contrast to the 2-year median observed across all other non-supervisory positions. Prior research within higher education indicates that a median tenure of 2 years is common for non-supervisory roles.[31]
Figure 7. Median Years in Position for Business and Finance Employees
Employee Retention
Business and Finance Employees Are Less Likely to Look for New Job Opportunities
In 2025, CUPA-HR administered the third iteration of its Higher Education Employee Retention Survey to identify the key drivers that shape employee retention in higher ed.[32] This section presents findings specific to business and finance employees, drawing on employee-reported data to highlight the aspects of work that influence decisions to stay or leave.
Business and finance employees are less likely to seek other employment within the next year compared to all other staff workforce areas (Figure 8). Overall, one in four (25%) higher ed staff indicated they are likely or very likely to look for new job opportunities in the next year, compared with 21% of business and finance employees. In fact, three out of five (60%) business and finance employees reported that they are unlikely or very unlikely to seek new job opportunities in the next year.[33] This is a 4-percentage point increase since 2023 when 56% of business and finance employees reported that they were unlikely or very unlikely to look for a new job.[34] These results suggest that business and finance employees are comparatively stable in their intentions to remain in their positions, which compares favorably to retention findings in other higher ed staff workforce areas.
Figure 8. Likelihood of Business and Finance Employees Looking for Other Employment Within the Next Year
Business and Finance Employees Experience a Notable Mismatch Between Desired and Actual Work Arrangements
Only 24% of business and finance employees currently work in a hybrid (partially on-site and partially remote) or fully remote arrangement, yet 66% say they prefer hybrid or remote work (Figure 9). This gap highlights a substantial misalignment between current work structures and employee preferences. Moreover, three-quarters of business and finance employees report that their positions mostly involve duties that can be performed remotely. Currently, the majority of higher ed institutions offer full-time hybrid (82%), or full-time remote (71%) work arrangements.[35] This indicates that institutions can leverage existing policies to increase the availability of preferred work arrangements for their business and finance workforces.
Figure 9. Current and Preferred Work Arrangements
To measure the degree of disconnect between employees’ preferred and actual work arrangements, a misalignment score was computed by subtracting respondents’ current arrangement scores from their preferred scores (based on a 5-point scale).[36] Business and finance employees show the greatest misalignment (0.97) compared with all other staff workforce areas (see Figure 10). This finding highlights an opportunity to better align business and finance employees’ preferred and actual work arrangements, especially because hybrid and remote work are both feasible and desired for this workforce.
Figure 10. Misalignment Between Preferred and Current Work Arrangement
by Staff Workforce Area
Conclusions
In examining the higher education business and finance workforce, this report uncovers several key findings: representation gaps for people of color in administrative roles, disproportionately large pay gaps for female administrators over 48 years old, and the need to expand flexible work arrangements. Additionally, the report highlights important strengths, including compensation advantages at doctoral institutions, strong representation of women, and a lower likelihood of seeking new job opportunities compared to other staff workforce areas.
The biggest business and finance workforces are found at doctoral institutions, which also lead in compensation, especially for administrators and supervisors. Doctoral institutions have the largest and most varied business and finance workforces, with a median of 16 employees — twice the size of other types of institutions. Their structures typically include multiple administrators overseeing broad units, supported by several supervisors with a range of non-supervisory staff. This model reflects the complexity of research universities, where business and finance operations extend beyond standard functions to include grant accounting, lab budgeting, and financial oversight for units like athletics.
Women are well represented in business and finance positions, but the representation of people of color is low among supervisors and administrators. Women are strongly represented across business and finance roles. However, the representation of people of color is aligned with the U.S. workforce only in non-supervisor positions. Relative to the pool of qualified individuals in the U.S. workforce, the representation of people of color is moderately lower for supervisors and substantially lower for those in administrator roles.
Women are paid less than men, and women in administrative roles experience the largest pay disparities. Despite strong representation, women in business and finance are paid less than men, with pay gaps especially pronounced for Black, Hispanic/Latina, and White women across all positions. Overall, the pay gap is wider for supervisors compared to non-supervisors, and wider still for administrators compared to supervisors, demonstrating wider pay gaps for women in more advanced roles.
Female administrators over the age of 48 face the most substantial pay equity challenges. Women in all six age-and-position groups analyzed are paid inequitably.Notably, the pay gap observed for women over 48 is substantially larger for those in administrator roles. Female administrators who are 48 and younger are paid $0.97 for every dollar paid to White male administrators of the same age. In comparison, female administrators over 48 are paid $0.82 for every dollar paid to their White male counterparts — a gap exceeding $30,000 annually. Beyond the immediate loss of income, these large differences in pay considerably diminish both lifetime earnings and accumulation of retirement wealth.
Women over 48 also display larger pay gaps than women who are 48 and younger in non-supervisor roles. In contrast, among supervisors, women 48 and younger have larger pay gaps than women over 48. However, overall pay ratios for supervisors are lower than those for non-supervisors. Taken together, these findings highlight that both age and leadership level amplify gender-based compensation disparities for women. They also highlight wider pay gaps for women in roles that require specialized skills and increased leadership responsibilities.
Administrator roles exhibit the longest median years in position, providing the stable social capital and institutional knowledge necessary for strategic execution. Two-thirds of administrators have a median of at least 4 years in their positions. This longevity is a critical asset for higher education institutions, as it ensures the long-term commitment necessary to sustain meaningful institutional value. The median length of time in position for supervisors is 3 years. A notable exception is the head of accounting, which has a median of 5 years in position — two years longer than the 3-year median observed across all other supervisory positions. Among non-supervisors, most have a median of 2 years in position.
Business and finance staff report the highest discrepancies between desired and actual work arrangements. Due to limited remote/hybrid work arrangements, business and finance employees experience the most misalignment compared to all other higher ed workforce areas. This finding highlights that many business and finance employees believe their duties are suitable for remote work, and the expectation to primarily work on-site may detract from their overall satisfaction. Nevertheless, business and finance staff remain notably stable in their intentions to stay in their positions, which compares favorably to retention findings across other staff workforce areas.
Recommendations
The findings in this report identify opportunities to further strengthen the business and finance higher ed workforce. Specifically, these include ensuring teams are adequately staffed, reducing barriers to access for administrator roles, improving pay equity for women (particularly those in administrator roles), and expanding options for flexible work arrangements. The following recommendations offer actionable strategies for higher education leaders to implement.
Benchmark size and structure to maintain appropriate staffing levels. Align your institution’s business and finance staff size with the benchmarks provided in this report to optimize workforce capacity. Conduct a targeted assessment of your institution’s business and finance structure to determine whether additional positions are required to alleviate operational strain and maintain service excellence.
Create and promote mentorship and leadership development programs that are equally accessible to all. Proactively identify and cultivate talent pipelines, provide mentorship opportunities, and ensure equitable access to high-visibility projects. These strategies can help foster a more inclusive leadership culture across business and finance workforce areas, which can have a favorable impact on employee satisfaction with their work environment.[37]
Conduct comprehensive pay equity reviews and implement targeted compensation adjustments to address age- and gender-based disparities. Commit to regularly audit salaries across all business and finance roles, with particular attention to women in administrator roles. Establish transparent pay structures to support more equitable compensation across varying levels of role complexity. Additionally, linking compensation decisions to objective performance metrics and unbiased access to advancement opportunities can help reduce systemic pay inequities over time. Addressing pay equity issues will enhance women’s long-term financial stability and the growth of their retirement assets.[38]
Expand flexible work options to align with employee preferences and role suitability. Broaden the availability of hybrid and remote work options across all business and finance roles. Aligning flexible work policies with employee preferences will directly improve employee retention, job satisfaction, and work-life balance. Also, consider other factors that impact retention as outlined in the recommendations of The CUPA-HR 2025 Higher Education Employee Retention Survey.[39]
About the Author:
Diana Tubbs, Ph.D., is a senior survey researcher at CUPA-HR.
Graphics were created by Kate Roesch, data visualization developer at CUPA-HR.
Citation for This Report:
Tubbs, Diana. (2026, April). The Higher Ed Business and Finance Workforce. CUPA-HR. https://www.cupahr.org/resource/the-higher-ed-business-and-finance-workforce/
Read our full research disclaimer and terms of use.
Lane, P., Falkenstern, C., & Bransberger, P. (2024). Knocking at the College Door: Projections of High School Graduates. Western Interstate Commission for Higher Education.
NACUBO. (2025). State of Higher Education: Top 5 Business Issues of 2025.
Kelchen, R. (2025, February 28). How Dire Is Higher Ed’s Budget Crunch? The Chronicle of Higher Education.
CUPA-HR. (2025). Administrators and Professionals in Higher Education Surveys, 2024-25 [Data set].
Kochhar, R. (2023, March). The Enduring Grip of the Gender Pay Gap. Pew Research Center.
Schneider, J., & Bichsel, J. (2025). The CUPA-HR 2025 Higher Education Employee Retention Survey. CUPA-HR.
Details on individual positions are available in CUPA-HR’s Survey Participation and Information Templates.
Data on administrator positions are collected in the CUPA-HR Administrators in Higher Education Survey. Data on supervisor and non-supervisor positions are collected in the CUPA-HR Professionals in Higher Education Survey. See the Survey Participation and Information Templates of each survey for complete position descriptions.
In this report, the term classification refers to the 2025 Carnegie Classification based on highest degree awarded.
A percentile situates a value relative to others in the dataset by showing the percentage of values that fall below it. For example, at baccalaureate institutions, 25% have fewer than 4 employees in business and finance roles, and at doctoral institutions, 75% have fewer than 36 employees in business and finance roles.
Common positions were identified by calculating the proportion of institutions that reported a business/finance position by the four classification categories: associate’s, baccalaureate, master’s, and doctoral. All 23 business/finance positions were represented in each of the four classification categories. Within each classification category, positions that were reported by 40% or more of institutions were defined as common. Reporting were 129 associate’s institutions, 188 baccalaureate institutions, 255 master’s institutions, and 434 doctoral institutions.
Total institutional operating expenses are reported to CUPA-HR each year and represent the same figure reported to IPEDS in its 2023-24 Spring Finance Survey.
Fuesting, M. (2023). The Higher Ed Admissions Workforce: Pay, Diversity, Equity, and Years in Position. CUPA-HR.
This was determined by viewing the representation of women across all professional positions in CUPA-HR’s 2025 workforce data, Professionals Composition and Pay Equity by Gender and Race/Ethnicity.
Graduate degrees include master’s, doctoral, and professional-level degrees (e.g., JD, MBA, MD).
This was determined by viewing the representation of women across all administrator positions in CUPA-HR’s 2025 workforce data, Administrators Composition and Pay Equity by Gender and Race/Ethnicity.
The term “people of color” refers to people who identify as Asian; Black; Hispanic or Latina/o; Native American or Alaska Native; Native Hawaiian or Other Pacific Islander; or two or more races.
Rock, D., & Grant, H. (2016, November 4). Why Diverse Teams Are Smarter. Harvard Business Review.
Schneider, J., & Bichsel, J. (2025). The CUPA-HR 2025 Higher Education Employee Retention Survey. CUPA-HR.
Ibid.
Median pay ratios control for position. Median salaries by race/ethnicity and gender for each business/finance position were obtained; then the median of those medians was calculated by race/ethnicity and gender. Finally, each group’s median salary was divided by the median salary of White men to calculate the pay ratio. This controls for the fact that women and people of color may be represented differently in specific positions that pay higher or lower salaries, and it means that the wage gaps present are not explained by the fact that women or people of color may have greater representation in lower-paying positions.
Median pay ratios for Asian, Black, and Hispanic male supervisors are not depicted due to low sample sizes.
First, the median age was calculated across all business and finance employees (administrators, supervisors, and non-supervisors), controlling for position, resulting in a median age of 48. Employees at each position level were then grouped into either “48 and Under” or “Over 48.” This yielded six groups: non-supervisors, 48 and Under and Over 48; Supervisors, 48 and Under and Over 48; Administrators, 48 and Under and Over 48. Next, for each of the six groups, a median salary for women and a median salary for White men were obtained. Finally, each group’s median salary for women was divided by the median salary of White men to calculate the pay ratio. For each of the six groups, the $1.00 line in Figure 6 represents the median salary of White men in that group. For example, female administrators over 48 are paid $0.82 for every $1.00 White male administrators over 48 are paid. For each of the six groups, at least 307 White male employees and at least 779 female employees provided data. Overall, 13,882 incumbents provided age, gender, and ethnicity data across 772 institutions.
A supplemental analysis assessed whether men and women differed in how many years they had been in their roles at each of the six groups. No significant differences were found between men and women.
This figure represents the difference between the median salary for White male administrators ($176,949) and female administrators ($145,968), a gap of $30,981.
Ghilarducci, T. (2023, January). The Gender Division of Labor and Its Effect on Retirement Security. TIAA Institute.
CUPA-HR’s data on years in position represents the number of years an incumbent has been in their position at their current institution. Therefore, data on years in position is not a measure of total years of experience in a position.
Overall, median years in position for non-supervisors is 2, for supervisors is 3, and for administrators is 4.
Guzzo, R., Nalbantian, H., & Anderson, N. (2023, January 24). Don’t Underestimate the Value of Employee Tenure. Harvard Business Review.
The median is the middle value in a list of numbers when they are arranged from smallest to largest.
Tubbs, D. (2025). The Higher Education Environmental Health, Safety, and Security Workforce. CUPA-HR.
Schneider, J., & Bichsel, J. (2025). The CUPA-HR 2025 Higher Education Employee Retention Survey. CUPA-HR.
Ibid.
Bichsel, J., Fuesting, M., Tubbs, D., & Schneider, J. (2023). The CUPA-HR 2023 Higher Education Employee Retention Survey. CUPA-HR.
CUPA-HR. (2025). 2024-25 Benefits, Employee Experience, and Structure in Higher Education Surveys [Data set].
Schneider, J., & Bichsel, J. (2025). The CUPA-HR 2025 Higher Education Employee Retention Survey. CUPA-HR.
Schneider, J., & Bichsel, J. (2025). The CUPA-HR 2025 Higher Education Employee Retention Survey. CUPA-HR.
American Association of University Women. (2025). The Not So Simple Truth About the Gender Pay Gap.
Schneider, J., & Bichsel, J. (2025). The CUPA-HR 2025 Higher Education Employee Retention Survey. CUPA-HR.