Since 1996, the National Committee on Pay Equity has acknowledged Equal Pay Day to bring awareness to the gap between men’s and women’s wages. This year, Equal Pay Day is March 26, symbolizing how far into the new year women must work to be paid what men were paid in the previous year.
To support leaders addressing gender pay equity in higher education, CUPA-HR has analyzed its annual higher ed workforce data to establish Equal Pay Days for higher education.
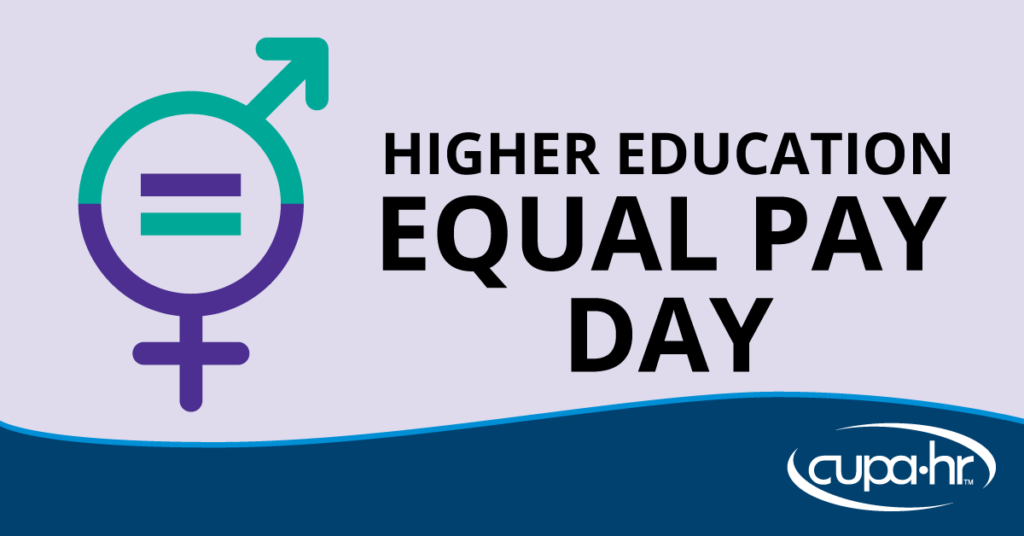
This year, Higher Education Equal Pay Day falls on March 2 for women in the higher ed workforce overall. That means women employees in higher education worked for more than two months into this year before they were paid what their White male colleagues were paid last year. Women in the higher ed workforce are paid on average just 83 cents for every dollar a White man employed in higher ed makes.
The gender pay gap persists for most women, and particularly for women of color. Here’s the breakdown of the gender pay gap in the higher ed workforce, and the Higher Education Equal Pay Day for each group.* These dates remind us of the work we have ahead.
- March 2 — Women in Higher Education Equal Pay Day. On average, women employees in higher education are paid 83 cents on the dollar.
- January 4 — Asian Women in Higher Education Equal Pay Day. Asian women in higher ed are paid 99 cents on the dollar.
- February 27 — White Women in Higher Education Equal Pay Day. White women in higher ed are paid 84 cents on the dollar.
- March 15 — Native Hawaiian/Pacific Islander Women in Higher Education Equal Pay Day. Native of Hawaii or Pacific Islander women in higher ed are paid 80 cents on the dollar.
- March 30 — Black Women in Higher Education Equal Pay Day. Black women in higher ed are paid 76 cents on the dollar.
- April 4 — Hispanic/Latina Women in Higher Education Equal Pay Day. Hispanic/Latina women in higher ed are paid 75 cents on the dollar.
- April 13 — Native American/Alaska Native Women in Higher Education Equal Pay Day. Native American/Alaska Native women are paid just 72 cents on the dollar.
CUPA-HR research shows that pay disparities exist across employment sectors in higher ed — administrators, faculty, professionals, and staff — even as the representation of women and people of color has steadily increased. But with voluntary turnover still not back to pre-pandemic levels, ignoring pay disparities could be costly.
Some Positive Momentum
Highlighting some positive momentum, several groups of women in higher education are reaching pay equity earlier than they did last year. The Equal Pay Day for Asian women (January 4) remained unchanged from 2025, and some progress is evident elsewhere:
- Black/African American women reached pay equity five days earlier than in 2025.
- White women also experienced progress, reaching equal pay six days sooner than in 2025.
- Hispanic/Latina women closed the gap a full week sooner.
- Native American/Alaska Native women saw one of the largest gains, moving their equal pay date up by 11 days.
- Native Hawaiian or other Pacific Islander women reached parity two weeks earlier than last year.
CUPA-HR Resources for Higher Education Equal Pay Days
As we observe Women’s History Month and Higher Education Equal Pay Days for women, we’re reminded that the quest for equal pay is far from over. But data-driven analysis with the assistance of CUPA-HR research can support your work to create a more equitable future.
CUPA-HR’s annual workforce data — based on data from CUPA-HR’s annual surveys and displayed through interactive graphics — highlight trends in the gender and racial/ethnic composition of the higher ed workforce. The following pay equity analyses control for position, indicating that any wage gaps present are not explained by the fact that women or people of color may have greater representation in lower-paying positions:
- Administrators Composition and Pay Equity by Gender and Race/Ethnicity
- Faculty Composition and Pay Equity by Gender and Race/Ethnicity
- Professionals Composition and Pay Equity by Gender and Race/Ethnicity
- Staff Composition and Pay Equity by Gender and Race/Ethnicity
*Data Source: 2025-26 CUPA-HR Administrators, Faculty, Professionals, and Staff in Higher Education Surveys. Drawn from 693,888 men and women for whom race/ethnicity was known (excluded those with two or more ethnicities). For more information on the methodology used, write us at [email protected].
Read our full research disclaimer and terms of use.