Using DataOnDemand


Whether you’re new to DataOnDemand (DOD) or a long-time subscriber, this page provides guidance on how to use DOD to make the most of your subscription.
Looking for guided learning? — In addition to the resources provided on this page, the CUPA-HR research team hosts virtual Research Skills Labs each month. These small workshops are designed to help you understand salary statistics, explore new ways to analyze data, and run basic and advanced DOD reports. Labs are sponsored by Segal.
Need data now (even if you can’t customize your comparison group)? If you need data right now and are unfamiliar with DOD, Ready Reports allow you to download a file containing data for all positions in any DOD survey to which you are subscribed. These reports provide a fast way of obtaining all the salary and sample size data within a specific operating expense or staff size quartile. You can find these reports after logging in to DataOnDemand under the Resources tab at the top. Keep in mind that Ready Reports limit you to the broad comparison groups that CUPA-HR has chosen.
Taking the time to learn DOD is well worth the rewards of running highly customized reports anytime you like. Keep reading for resources that help you unlock the full power of DOD.
Read our full research disclaimer and terms of use.
DOD Tutorials
Log In to DOD
I’m new to using DOD. How do I log in and get started?
First, you will log in to Surveys Online using your personal CUPA-HR username and password. View this video to see how to get started using DOD.

I do not seem to have access to DOD. How do I get access?
Your chief HR officer, CUPA-HR primary contact, or a designated DOD sub-administrator will need to grant you access to use DOD. If they are not sure how, here are instructions for accessing DOD. If you need assistance identifying this person at your institution, email CUPA-HR at [email protected].
I have been granted access to DOD, but I’m having trouble logging in.
If you have already been granted access but you are having trouble logging in, please email CUPA-HR at [email protected].
Comparison Groups
What is a comparison group?
A comparison group is a set of institutions used for benchmarking purposes. Each time you run a report in DOD, you will see aggregated results for the institutions in the comparison group you chose. DOD allows you to build comparison groups based on institution name or institution characteristics such as affiliation (e.g., public, private, private-religious), size (e.g., student FTE, operating expenses), classification (e.g., doctoral, baccalaureate), geographic region, and more.
How do I create a comparison group based on institution characteristics?
To create a comparison group based on institution characteristics, reference the tutorial above, Using the New Group Wizard. You can also see this video to get started with the New Group Wizard:

How do I create a comparison group based on institution names?
Identify the institutions you want to include in your new comparison group, and then reference the tutorial above, Creating a New Comparison Group From Scratch. You can also see this video to get started with the New Group From Scratch tool:

Can I edit a comparison group that I’ve already created/saved?
From the Comparison Groups page, you can edit the name or description of an existing comparison group by clicking the edit icon. This will open a pop-up window where you can make changes to the group name or description. You can edit the name and description of your comparison group at any time.

You can edit the institutions in a comparison group by clicking the name of the comparison group on the Comparison Groups page. All comparison groups must differ by at least three institutions from all other comparison groups created by your institution (not just those on your own account). If you have not yet used the comparison group to run a report, you can add or delete institutions in the group one at a time. Once the comparison group has been used to run a report, any changes must differ from the original group by at least three institutions. For that reason, it is important to make sure that your created groups include all institutions you wish to consider before you run any reports. For additional guidance on modifying or deleting comparison groups, email our research team at [email protected].
I created a comparison group but don’t see it as an option when I try to run a report. How do I activate a comparison group?
See this video to learn how to activate a comparison group.
Can I share a comparison group with my colleagues?
In some instances, you may want to share a custom-made comparison group with other DOD users at your institution. See the video below for guidance on sharing a comparison group.

Can I add or remove my institution from a comparison group I created?
Yes, you can! See the video below for guidance on adding or removing your institution from an existing comparison group.

Running DOD Reports
Where can I learn how to run reports in DOD?
CUPA-HR offers several resources to support users of DOD. Research Skills Labs are designed to help you run DOD reports, understand statistics, and explore new ways to analyze data. Tutorials (listed above) provide tailored guidance on specific topics, such as Benchmarking Department Size and Structure, Planning for Salary Increases, and Benchmarking Salaries for Specific Positions. You can also join CUPA-HR’s Data User Group, an online community that discusses tips for creating and sharing reports. Finally, the CUPA-HR research team ([email protected]) is available to help with any questions related to using DOD.
Where do I go to run a report?
See the video below for guidance on where to go to run a report. For detailed guidance on how to run a report, we recommend you refer to the Running DOD Reports tutorial in the list at the top of the page. For additional questions about running a report, email our research team at [email protected].

How do I use DOD to benchmark when creating or adjusting a position salary?
We recommend you refer to the Benchmarking Salaries for Specific Positions tutorial (in the list at the top of the page) for step-by-step guidance.
How do I use DOD to benchmark executive total compensation?
Institutions that participate in the Total Compensation section of the Administrators Survey can subscribe to Total Compensation DOD. After you’ve purchased and gained access to Total Compensation DOD, you’ll log in to Surveys Online and navigate to DataOnDemand > Survey Reports. Under “Administrators,” expand the menu for “Benchmark total compensation and executive benefits.” You have the option to run data one position at a time or for multiple positions at one time.
How do I use DOD to recreate legacy comprehensive tables?
If you want to use DOD to recreate the old legacy comprehensive tables that were in the back of our retired Annual Reports, refer to the How to Recreate Legacy Annual Tables Using the Multi-Position Report tutorial for step-by-step guidance.
How do I run a report to get demographic information (e.g., age, race, gender)?
Demographic reports in DOD compare your institution with comparison group institutions on age, race/ethnicity, and gender and median/mean salary for each position. After you log in to Surveys Online, navigate to DataOnDemand > Survey Reports. For reports on race/ethnicity and gender, use the “Benchmark pay equity and representation” report. For reports on age or years in position, use the “Obtain data on age and years in position” report.
How do I use DOD to budget for salary increases?
DOD can empower higher ed HR professionals to make important strategic decisions on budgeting salary projections. Refer to the tutorial on Planning for Salary Increases (in list at top of page) for guidance on budget planning using CUPA-HR’s customizable reports in DOD.
Where can I find information related to turnover?
After you log in to Surveys Online, navigate to DataOnDemand > Survey Reports. Under “Institutional Benchmarking,” use the “HR Benchmarking Report.” This report will produce a table that includes information on turnover and retirement rates for your institution as well as your comparison group.
Where can I find information on employee benefits?
The Benefits, Employee Experience, and Structure Survey (BEES Survey) collects data on benefits and much more. If your institution has a DOD subscription to the BEES Survey, you can run reports to benchmark traditional benefits like retirement, paid time off, and health care. From the Survey Reports menu on Surveys Online, reports on employee benefits can be found under “Benefits, Employee Experience, and Structure.” Data on healthcare and wellness programs are under the strategic question “Obtain data on healthcare benefits and wellness programs.” Data on dependent care benefits are under the heading “Obtain data on dependent care benefits.” Data on paid time off, tuition reimbursement and student loan repayment assistance, and retirement are under the heading “Obtain data on paid time off, tuition, or retirement benefits.”
Where can I find information on employee experience?
The Benefits, Employee Experience, and Structure Survey (BEES Survey) collects data on traditional benefits as well as topics related to employee experiences such as remote/flexible work arrangements, professional development opportunities and funding, performance evaluations, volunteer and community engagement, and time-to-hire and time-to-fill metrics. From the Survey Reports menu on Surveys Online, reports on employee experience can be found by navigating to “Benefits, Employee Experience, and Structure” and then selecting “Employee Experience.” All employee experience reports are listed by topic.
Where can I find information on institutional structure and policy?
The Benefits, Employee Experience, and Structure Survey (BEES Survey) collects data on traditional benefits as well as topics related to institutional structure and policies – for instance, which functions are outsourced, where certain HR-related functions are housed, and HR budget. From the Survey Reports menu on Surveys Online, reports on structure and policy can be found by navigating to “Benefits, Employee Experience, and Structure” and then selecting “Structure.”
Where can I find information on student/faculty/staff FTE size?
After you log in to Surveys Online, navigate to DataOnDemand > Survey Reports. Under “Institutional Benchmarking,” use the “HR Benchmarking Report.” Enter your comparison group and year of interest and click “Go to Report.” This report will produce a table that includes information on student/faculty/staff FTE and total operating expenses for your institution as well as your comparison group.

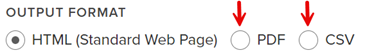
How do I save my report?
Before you run a report, you have the option to select the format of the report. You can select the PDF or CSV/Excel option under “Output Format.” This will generate a report file that you can download and save to your computer or network.
Interpreting Reports
Why are there blank rows of data in my report?
If your report is showing blank cells or rows of data, it means that a particular position has not met our confidentiality standards and, consequently, results cannot be shown. Try broadening your report parameters, such as using a larger comparison group.
What are percentiles?
Percentiles allow us to ascertain where a value stands relative to other values in a dataset. For example, if the 75th percentile for a position is $50,000, then approximately 75% of salaries in the dataset fall below $50,000.
Some percentiles have special names. For example, the 50th percentile is also called the median. The 25th, 50th, and 75th percentiles are sometimes called quartiles. The 40th and 60th percentiles are often used for the purposes of setting salary ranges that capture the 50th percentile.
What is the difference between means/averages and medians?
A mean (average) is calculated by adding together a list of values, then dividing by the total number of values:
{10, 12, 13, 15, 19, 25, 60} Mean/Average = 22 (Sum of All Values = 154, Divided by 7)
A median is the same as the 50th percentile (the point at which 50% of salaries are higher and 50% of salaries are lower). If the list has an odd number of values, the middle value is the median. If the list has an even number of values, the two middle-most values are averaged to get the median, like so:
{10, 12, 13, 15, 19, 25, 60} Median = 15
{10, 12, 13, 15, 16, 19, 25, 60} Median = 15.5
Though you should choose between a mean or median based on the data you are analyzing, the research team generally recommends using the median for the most common uses of DOD.
The benefit of using the median is that it is not sensitive to extreme values, whereas the mean/average is.
For instance, see this example:
{10, 12, 13, 15, 19, 25, 60}
Mean/Average = 22
Median = 15
Notice how the relatively higher value of 60 in this dataset inflates the average/mean of the dataset but not the median. Translated into salary benchmarking, when there are relatively high or low salaries in a database, the median will not be pulled up or down by these salaries.
Report Parameters (Advanced)
How does data aging work in DOD?
DOD allows you to age salary survey reports to see estimated salaries if the data were collected at a later point in time (i.e., the aging date). You can age the data from early November to early March of the following year, which is roughly the time until a new year of survey data is released based on CUPA-HR’s survey cycle. Reports with an option to age data list these specific dates under “Aging Date.” Data aging is only available for the most current year of data.
Aging is based on a projected annual rate of increase for the survey year and a portion of the subsequent year without compounding. A default aging factor for each survey is provided by CUPA-HR, which is equal to the average institutional raise for that survey over the past three years. If you have access to salary increase projections more specific to your institution and positions of interest, you can manually input a different rate instead.
This is an example of how aging works in DOD:
Current salary = $119,000
Aging Factor = 2%
Effective Date of the Data 11/1/2020
Aging Date = 7/1/2021
Aged Salary = $120,785
- The monthly aging percentage is calculated. Using the example above, divide 2% by 12 months (0.02/12) = 0.001667, this is the monthly aging rate.
- The monthly aging rate is multiplied by the number of months the data is being aged. Our aging date is 7/1/2021, which equals 9 months. In the example (0.001667 x 9) = 0. 015
- The salary that is being aged is multiplied by the rate calculated in the previous step. This will determine the amount that needs to be added to the salary. In the example $119,000 x 0.015 = $1,785
- The aged salary is the current salary plus the amount calculated in the previous step. In the example $119,000 + $1,785 = $120,785
What is the “compare by” setting on the report parameters page?
There are two methods you can use for benchmarking salary data:
Choose institutional average salaries when you want to understand what other institutions in your peer group typically pay a position. This is the most appropriate method when performing standard salary benchmarking and is the default selection on the DOD reports most often used for this purpose. The institutional-average-salaries method first calculates an average salary for the position at each institution and then provides results based on those institutional averages. Other organizations such as the Department of Labor refer to this calculation method as unweighted salaries.
Choose incumbent salaries when you want to understand how pay differs by the individual characteristics of employees themselves (e.g., sex, race/ethnicity, age, years in position). This is the default selection on DOD demographic reports. The incumbent-salaries method combines all employees for a given position and provides results based on individual salaries, regardless of institution. Other organizations such as the Department of Labor refer to this calculation method as weighted salaries.
What is the “Filter Outliers” option in DOD?
Outliers are data points that exist far outside of the range of what is considered “normal” in a dataset. For example, say that a department has five professors. One is an endowed chair paid much more than her counterparts. If her salary is excluded from the analysis, the mean (average) salary is a much better reflection of pay in the department than when her salary is included. You might want to consider her salary to be an outlier when setting the salary for a new hire and offer $87,500 instead of $98,000 to your applicant.

If you suspect that a few highly-paid or low-paid individuals (or institutions) are disproportionately impacting the mean, you have two options. The first is to use the median instead of the mean, which is a more robust measure of the center of a dataset’s distribution. The second is to try the “Filter Outliers” option in DOD to exclude any statistically rare cases and obtain a more accurate mean.
In Faculty DOD reports, what does the setting “highest degree attained” mean?
On relevant Faculty DOD reports, you will find the option to filter by highest degree obtained by the incumbent. Important note: This setting does not filter by the type of degree the faculty member is teaching or the types of degree their employer offers. By default, all reported faculty are included. If you use this filter, all unknown/unreported cases are also dropped and only those reporting the degree(s) checked are included. In some cases, this can result in no data (e.g., there are not likely to be many tenure-track faculty with associate’s degrees at doctoral institutions). For best results, do not filter unless you have a specific need to do so.
In Faculty DOD, what is the salary factor?
The salary factor is the ratio of the average salary for a given academic rank and discipline to the average salary across all disciplines selected in your report. It estimates a “market value” for each discipline relative to all other disciplines selected in the report. A salary factor of 1.00 indicates that professors of that rank and discipline are paid relatively similarly to faculty at that rank in all other disciplines selected in the report. A salary factor of below 1.00 indicates that faculty at that rank and discipline are paid less than faculty at that rank in other disciplines selected in the report. A salary factor of over 1.00 indicates that faculty at that rank and discipline are paid more than other faculty at that rank in other disciplines selected in the report. Essentially, a salary factor of above 1.00 is indicating that faculty in that discipline are being paid a premium for teaching in that discipline, and a salary factor of below 1.00 is indicating that faculty in that discipline are being paid less for teaching in that discipline.
Complex Reports (Advanced)
What report do I use to benchmark salaries for a position at my institution that is a combination of two or more positions in CUPA-HR’s data?
There may be instances where a person or position at your institution does not fit well with a single position in our surveys. In this case, you may want to benchmark salaries of two or more combined positions that better reflect the responsibilities of the position at your institution. First, review the relevant Survey Participation and Information Templates to ensure the descriptions match the position at your institution. Then, select a survey and use the “Aggregated Positions Report” to estimate salary data for a combined-function position. This report is ideal for combining positions that have similar median salaries, but the small salary differences between the positions are meaningful and important to consider for benchmarking.
Can I use DOD to identify a prevailing wage for the Department of Labor (DOL)?
Yes. When properly documented, you can use DOD’s prevailing wage report to determine the prevailing wage and use this as a supporting document in connection with an H-1B petition. For detailed guidance on running a prevailing wage report, we recommend you refer to the Determining a Prevailing Wage for DOL tutorial in the list at the top of this page.
Can I compare salaries by exempt status for the same position?
Yes, you can! The “Exempt Status Comparison” report offers the ability to compare salaries for exempt and non-exempt incumbents of the same position. For detailed guidance on running this report, we recommend you refer to the Exempt Status Comparison Report tutorial in the list at the top of this page.