
The Representation of Women and Racial/Ethnic Minorities in the Workforce of Minority-Serving Higher Education Institutions
By Anthony Schmidt | February 2022
Introduction
Minority-serving institutions (MSIs) occupy a unique space within the higher ed landscape. They are federally-recognized institutions that serve students of color, many of whom are first-generation and low-income. Therefore, MSIs play an important role in ensuring students from underrepresented races and ethnicities receive a quality education.
MSIs enroll more than 5 million students, about whom there is an abundance of research.1CASE. (n.d.). Minority Serving Institutions. , 2ACE. (n.d.). Minority Serving Institutions in Focus. Higher Education Today. However, very little research has examined the MSI workforce. Specifically, no research has examined faculty, administrator, professional, and staff racial/ethnic representation and how this representation reflects the student populations being served.
Research across a range of industries shows that minority representation leads to benefits for minority populations. For example, concordances between racial/ethnic representation in organizations and the populations they serve have been associated with improved institutional trust and performance.3Hong, S. (2021). Representative Bureaucracy and Hierarchy: Interactions Among Leadership, Middle-Level, and Street-Level Bureaucracy. Public Management Review, 23(9), 1317-1338. The benefits of racial/ethnic representation also extend beyond minority populations. A diverse workforce can drive innovation, performance, and revenue across the institution.4Lorenzo, R., & Reeves, M. (2018). How and Where Diversity Drives Financial Performance. Harvard Business Review, 30, 1-5.
These benefits also appear at higher education institutions. Research suggests that student performance is increased when there is a greater match between student and faculty racial/ethnic characteristics.5Fairlie, R. W., Hoffmann, F., & Oreopoulos, P. (2014). A Community College Instructor Like Me: Race and Ethnicity Interactions in the Classroom. American Economic Review, 104(8), 2567-91. Students who have educators from similar racial/ethnic backgrounds report greater academic attitudes, motivation, communication, and effort.6Egalite, A. J., & Kisida, B. (2018). The Effects of Teacher Match on Students’ Academic Perceptions and Attitudes. Educational Evaluation and Policy Analysis, 40(1), 59-81. Furthermore, institutional representation has a positive impact on students and their own notions of leadership and equity.7Arday, J. (2018). Understanding Race and Educational Leadership in Higher Education: Exploring the Black and Ethnic Minority (BME) Experience. Management in Education, 32(4), 192-200. , 8Grissom, J. A., Kern, E. C., & Rodriguez, L. A. (2015). The “Representative Bureaucracy” in Education: Educator Workforce Diversity, Policy Outputs, and Outcomes for Disadvantaged Students. Educational Researcher, 44(3), 185-192. A diverse higher education workforce, especially among faculty, helps attract diverse students. A diverse faculty also helps increase variety in research agendas and instructional techniques.9Espinosa, L. L., Turk, J. M., Taylor, M., & Chessman, H. M. (2019). Race and Ethnicity in Higher Education: A Status Report. American Council on Education. In sum, where institutional racial/ethnic representation occurs, it can foster policies that help improve the experience for both employees and students.
The purpose of this report is three-fold. First, it aims to provide an overall snapshot of the landscape of MSIs. This report will define the various MSI types, give an overview of their representation among all U.S. higher education institutions, and show their geographic spread across the country. Second, the report will provide a closer examination of racial/ethnic and gender composition of faculty, administrators, professionals, and non-exempt staff using data collected by CUPA-HR’s 2020 higher education workforce surveys. Finally, the report will assess how well the racial/ethnic composition of the higher ed workforce at MSIs reflects their student populations and matches the minority-serving mission of the institutions.
What Are MSIs?
Minority serving institutions (MSIs) are federally recognized colleges and universities that serve specific groups of racial/ethnic minority students. These institutions must meet certain criteria in order to be designated as MSIs, as outlined in the Higher Education Act, first passed in 1965.10U.S. Department of Education. (n.d.). Overview. https://www2.ed.gov/about/offices/list/ocr/edlite-minorityinst.html MSIs must be accredited higher education institutions which enroll a particular percentage of specific undergraduate minority students, 50 percent of whom must receive need-based assistance, especially Pell Grants.1120 U.S. Code § 1058. This status typically entitles these institutions to additional funding and grants.
Within the U.S., MSIs are classified into five different types: Asian American and Native American Pacific Islander Serving Institutions (AANAPISIs), Hispanic Serving Institutions (HSIs), Historically Black Colleges or Universities (HBCUs), Native Serving Institutions (NSIs), and Predominantly Black Institutions (PBIs). See Appendix A for definitions. Institutions may have one or more MSI classifications. This report will focus on AANAPISIs, HSIs, HBCUs, NSIs, and Non-MSIs (Non-Minority Serving Institutions).12Although PBIs are included in the ”Composition of MSIs“ section, they are excluded from the ”MSIs in CUPA-HR Data” section due to extremely low representation in our dataset.
The Composition of MSIs
From the entire population of degree-granting higher education institutions in the United States (N = 4,148), 10% (n = 400) of institutions have been identified as MSIs.13Based on 2020 IPEDS data for all degree-granting U.S.-only institutions, https://nces.ed.gov/ipeds/datacenter/InstitutionByGroup.aspx Of the 400 MSI institutions, 98% had a single MSI type, whereas 2% of institutions could be classified as two types, with most of these institutions serving both AANAPSI and HSI populations.14If an institution has two types (e.g. AANAPISI and HSI, it is included separately in the analysis for each of its types (once for AANAPISIs and once for HSIs).
Table 1 shows the number of institutions by MSI type. HSIs represent the largest number of MSIs, followed by HBCUs.
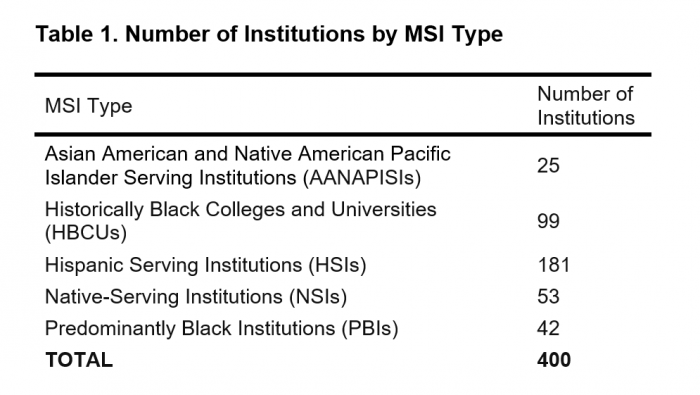
Table 2 categorizes MSIs by Carnegie classification and affiliation. Most MSIs (79%) are public institutions, and nearly half (45%) are public associate’s institutions.
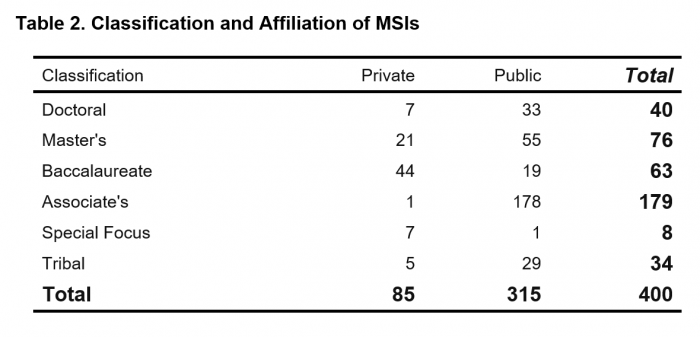
Figure 1 displays the location of MSIs across the United States. Although MSIs are widespread, most are concentrated across the southern states. These states have larger Hispanic/Latinx populations; thus, most HSIs (the most common MSI) are found in this area.15Frey, W. H. (2019). Six Maps That Reveal America’s Expanding Racial Diversity. Brookings. HBCUs and PBIs are mostly concentrated in the southeastern U.S. Their locations reflect the segregationist history of the South. With de jure institutional and community segregation, institutions were founded to exclusively serve Black communities who otherwise lacked access to higher education. NSIs are mainly found across the Midwest and in Alaska and Hawaii, which represent the highest concentrations of Native Americans in the U.S.16NSIs are typically Tribally-formed institutions or institutions with large populations of Native students. Many of these institutions are found on or near Native reservations or areas with larger populations of Native Americans. However, the NSI institutions that contributed faculty data to CUPA-HR may be distinct from the NSIs in general and NSIs that contributed data to other surveys.
Figure 1. Map of Minority-Serving Institutions
Institutional Characteristics of MSIs
The following sections include only those institutions that participated in one or more of CUPA-HR’s annual surveys.17CUPA-HR collects annual survey data on administrative, faculty, professional, and staff positions from a large and representative sample of higher education institutions. In 2019-20, more than 1,300 institutions participated in our annual surveys. Among these institutions, 88 (22%) of 400 MSIs contributed data to one or more of our annual surveys. Figure 2 shows key institutional statistics for each MSI type, including total expenses, student size, faculty size, and staff size.18The term “staff” refers the combination of administrators, professionals, and non-exempt staff. AANAPISIs are the largest institutions in terms of median expenses and student, faculty, and staff full-time equivalent (FTE). AANAPISI numbers are higher than other institutional types because they consist of several large universities (such as University of California-Irvine and San Francisco State University) in populous cities.19There are only 9 AANAPISIs in our sample, meaning there is little variation that can shift median values up or down. These 9 institutions represent 36% of all AANAPISI institutions; thus, the values are thought to offer an adequate representation of all AANAPISIs. In contrast to AANAPISIs, NSIs, which are targeted toward a smaller population of students, represent the smallest of the MSI institutions.
Figure 2. Expenses and Student, Faculty, and Staff Sizes for MSIs
Faculty at MSIs
Faculty include tenure-track and non-tenure-track teaching ranks of instructor, assistant professor, associate professor, and full-professor.20See CUPA-HR’s Faculty in Higher Education Survey for more information. Figure 3 shows the representation of faculty by racial/ethnic minority status, specific race/ethnicity, and gender. Data on faculty are from across all disciplines.
Overall, MSIs have a higher representation of racial/ethnic minorities among tenure-track faculty than do non-MSIs. Tenure-track and non-tenure-track faculty at MSIs are comprised of 39% racial/ethnic minorities compared to 22% of non-MSI tenure-track faculty and 19% of non-tenure-track faculty.
For reference, 29% of doctoral degree holders nationwide are racial/ethnic minorities, and all MSI types except for NSIs have a higher representation of racial/ethnic minorities within their faculty than this value, aligning with their mission to serve specific populations and meeting or exceeding the nationwide representation of doctorate degree holders.21Ruggles, S., Flood, S., Goeken, R., Grover, J., Meyer, E., Pacas, J., & Sobek, M. (2020). IPUMS USA: Version 10.0 [dataset]. doi.org/10.18128/D010.V10.0 In short, MSIs tend to have higher racial/ethnic minority representation among faculty than the available pool of minority doctoral degree holders. In contrast, the representation of minority faculty at non-MSIs is less than the available pool of minority doctoral degree holders.
Among the minority racial/ethnic groups at NSIs, Native men and women make up only a small proportion of tenure-track faculty (3%), with most minority tenure-track faculty categorized as Asian (7%). White faculty have the greatest representation among tenure-track faculty at NSIs (84%).22See CUPA-HR’s Administrators in Higher Education Survey for a full list of administrative positions on which CUPA-HR collects data. At HBCUs, the majority of tenure-track faculty are racial/ethnic minorities (76%). Over half (54%) of HBCU tenure-track faculty are Black, nearly equally divided between women and men. That a majority of HBCU tenure-track faculty are Black indicates HBCUs are the only MSI whose faculty reflects a majority of the population they serve according to their MSI designation.
Non-tenure-track faculty racial/ethnic minority representation is very similar to that of tenure-track faculty. However, non-tenure-track faculty are comprised of more women of color than are tenure-track faculty.
Figure 3. Representation of Tenure-Track Faculty by Race/Ethnicity, Gender, and MSI Type
Administrators at MSIs
CUPA-HR’s Administrators in Higher Education Survey collects data on chief campus leaders.23See CUPA-HR’s Professionals in Higher Education Survey for a full list of professional positions on which CUPA-HR collects data. The representation of administrators by racial/ethnic minority status (minority or White), specific racial/ethnic group, and gender for both MSIs and non-MSIs appears in Figure 4. Overall, MSIs have a greater representation of racial/ethnic minorities than do non-MSIs across six administrator functional areas. HBCUs have the greatest racial/ethnic minority representation in administrative positions in each area. HBCUs and NSIs also have the largest representation of racial/ethnic minority female administrators. At HBCUs, nearly one-third (32%) of top executive officers are women of color, and more than one-third (36%) of administrators overall are women of color.
Figure 4. Representation of Administrators by Racial/Ethnic Minority Status and Gender
Professionals at MSIs
Figure 5 displays the representation of professionals overall and for nine functional areas.2ACE. (n.d.). Minority Serving Institutions in Focus. Higher Education Today. Professionals tend to be salaried and have domain-specific expertise. Overall, MSIs have a greater representation of racial/ethnic minorities in professional positions than do non-MSIs. At MSIs, 40% or more of professional positions are filled by racial/ethnic minorities compared to 25% at non-MSIs. Women are well represented in many professional areas in both MSIs and non-MSIs, with more women of color represented at MSIs. HBCUs have the largest representation of racial/ethnic minority professionals, with Black men and women as the largest racial/ethnic group. At HSIs, Hispanic/Latinx is the majority racial/ethnic group among professionals, with Hispanic/Latinx women employed in the majority of positions. At NSIs, Native employees can be found in all professional areas except for athletics and external affairs (possibly because these two areas are small or nonexistent at NSIs).
Figure 5. Representation of Professionals by Racial/Ethnic Minority Status and Gender
Staff at MSIs
Staff mostly work hourly, non-exempt positions that do not require a college degree.25Nadel-Hawthorne, S., Fuesting, M., Schmidt, A., & Bichsel, J. (2021, June). Staff in Higher Education Annual Report: Key Findings, Trends and Comprehensive Tables for the 2020-21 Academic Year (Research Report). CUPA-HR. https://www.cupahr.org/surveys/results The staff workforce has greater racial/ethnic minority representation than other areas.26Fuesting, M. & Schmidt, A. (2021, February). The Higher Ed Skilled Craft Workforce: Pay, Aging, Diversity, and Equity (Research Report). CUPA-HR. , 2720 U.S. Code § 1059g Figure 6 displays staff representation at MSIs and non-MSIs. Overall, staff at MSIs are comprised of a large percentage of racial/ethnic minorities (67%). These patterns hold for all MSI types except NSIs. At NSIs, White men and women comprise the majority of staff, and no minorities are represented in the skilled craft area. Staff at HBCUs and HSIs tend to reflect their MSI status, with Black and Hispanic/Latinx employees having the greatest representation across all staff areas at their respective MSI types. Across all institution types, racial/ethnic minority women are typically more represented then racial/ethnic minority men in office/clerical and technical/paraprofessional positions.
Figure 6. Representation of Staff by Racial/Ethnic Minority Status and Gender
Workforce and Student Representation
This section assesses the extent to which the racial/ethnic composition of the higher ed workforce at MSIs reflects their student populations. Figure 7 illustrates this representation in greater detail by allowing one to review the primary higher education workforce areas (faculty, administrators, professionals, and staff) and compare representation in that area to undergraduate student representation by MSI type.
Faculty
Overall, MSIs show a discordance between faculty and student racial/ethnic representation. Whereas racial/ethnic minority students represent the largest proportion of the MSI student population, this is rarely reflected in MSI faculty. In other words, MSI faculty overall are still primarily White and therefore present a faculty-student representation imbalance. Across all MSIs, the proportion of Black and Hispanic/Latinx students is larger than the proportion of Black and Hispanic/Latinx faculty.
However, some MSI types show more balanced racial/ethnic representation between faculty and students compared to MSIs overall. The majority of students at HBCUs are students of color (93%), as are their faculty (tenure-track: 76%; non-tenure-track: 81%). In addition, Asian students and Asian tenure-track faculty in AANAPISIs are nearly identical in representation, with Asian students making up 21% of students, and Asian tenure-track faculty making up 21% of faculty. However, Asian non-tenure-track faculty only number half of Asian students at AANAPISIs. AANAPISIs also have a high percentage of Hispanic/Latinx students (23%) with low Hispanic/Latinx faculty representation (tenure-track: 6%; non-tenure-track: 9%). At NSIs, Native non-tenure-track faculty (7%) more closely match Native student representation (9%) than Native tenure-track faculty (3%). The same pattern holds true for Hispanic/Latinx faculty at HSIs.
Administrators
Representation of administrators closely tracks student racial/ethnic representation for MSIs overall. At HBCUs, racial/ethnic representation of administrators closely matches student representation: Black administrators represent 80% of the administrative population, and Black students represent 80% of the student population. At NSIs, Native administrators represent 23% of administrators, whereas the student population is made up of 9% Native students. However, at AANAPISIs, Asians represent only 10% of administrators and 21% of students. Likewise, at HSIs, Hispanic representation in administrative positions (21%) is less than half the representation of Hispanic students (54%).
Professionals
Asian representation among professionals at AANAPISIs (18%) is much closer to Asian student representation (21%) than it is among administrators (10%). Hispanic professionals’ representation at HSIs (27%) is only half that of its Hispanic student population (54%). At NSIs, Native professionals’ representation (10%) is in concordance with the represention of Native students (9%).
Staff
Staff exhibit the closest match to students in terms of racial/ethnic representation for nearly all MSI types. In fact, at all institution types except for non-MSIs and NSIs, racial/ethnic minorities comprise the largest percentage of staff.
Figure 7. Representation of Higher Ed Employees and Undergraduate Students by Workforce Area and Race/Ethnicity
Key Points
The following points summarize the findings of this report:
- MSIs have higher racial/ethnic minority representation among their workforce than non-MSIs.
- HBCUs have the highest representation of racial/ethnic minority employees.
- Overall, the representation of racial/ethnic minority faculty at MSIs does not match the representation of students, which is often higher than faculty.
- Overall, administrators, professionals, and staff at MSIs have similar racial/ethnic minority representation when compared to students.
About the Author:
Anthony Schmidt, M.S.Ed., is a former data visualization researcher at CUPA-HR and is now a data scientist at Amplify.
Citation for This Report:
Schmidt, Anthony. (2022, February). The Representation of Women and Racial/Ethnic Minorities in the Workforce of Minority-Serving Higher Education Institutions (Research Report). CUPA-HR.
Appendix A – Definitions of MSIs
The specific definitions, data sources, and inclusion criteria for each MSI featured in this report are below, listed in alphabetical order:
Asian American and Native American Pacific Islander-Serving Institutions (AANAPISI)
AANAPISIs enroll at least 10% Asian American or Native American Pacific Islanders and have received Title III grants based on this enrollment.28Native American Pacific Islanders refer to ”any descendant of the aboriginal people of any island in the Pacific Ocean that is a territory or possession of the United States” (20 U.S. Code § 1059g).
, 2920 U.S. Code § 1101a
Any institutions that received a grant between 2017 and 2020 according to (OPE) Eligibility Matrices were designated AANAPISIs for this report.
Hispanic-Serving Institutions (HSI)
HSIs enroll at least 25% Hispanic students and have received a Title III grant.30Li, X. (2007). Characteristics of Minority-Serving Institutions and Minority Undergraduates Enrolled in These Institutions (NCES 2008-156). National Center for Education Statistics, Institute of Education Sciences, U.S. Department of Education. Washington, DC.
Data for HSI eligibility comes from the OPE Eligibility Matrices. Any institution that received a Title III grant between 2017 and 2020 were designated HSIs for this report.
Historically Black Colleges and Universities (HBCU)
An institution’s designation as an HBCU predates the HEA of 1965. HBCUs were first identified in 1964 as institutions “whose primary mission was the education of African Americans.”3120 U.S. Code § 1059d
The official list of HBCUs is maintained by the White House Initiative on Historically Black Colleges and Universities. Data and inclusion of HBCUs for this report is based on HBCU designation in IPEDS.
Native-Serving Institutions (NSI)
For this report, several related MSIs have been grouped together under the designation of NSI due to small sample sizes in CUPA-HR data. These institutions include:
Alaska Native and Native Hawaiian-Serving Institutions (ANNH)
ANNH institutions enroll at least 20% Alaska Native or 10% Native Hawaiian students.3220 U.S. Code § 1059f
Any institution that received a Title III grant (as reported by the OPE) between 2017 and 2020 were designated ANNH for this report.
Native American-Serving Non-Tribal Institutions (NA Non-Tribal)
NA Non-Tribal institutions enroll at least 10% Native American students and are not designated as a Tribal College or University.33U.S. Department of Education (n.d.). List of tribal colleges or universities. https://www2.ed.gov/about/offices/list/ocr/edlite-minorityinst-list-pg5.html
Any institution that received a grant (as reported by the OPE) between 2017 and 2020 were designated NA Non-Tribal for this report.
Tribal College or University (TCU)
TCUs were established through several legislative acts. They comprise institutions listed in the Tribally Controlled Community College Assistance Act of 1978, the Navajo Community College Assistance Act of 1978, and the Equity in Educational Land-Grant Status Act of 1994.34Indiana University Center for Postsecondary Research. (n.d.). Basic classification description. https://carnegieclassifications.iu.edu/classification_descriptions/basic.php
The current list of TCUs is maintained by the White House Initiative on Tribal Colleges and Universities. Their official definition is also consolidated in the Higher Education Act. TCUs are institutions formally controlled by tribal governing bodies. TCUs also have a separate Carnegie Classification, “Tribal College,” which indicates members of the American Indian Higher Education Consortium (http://www.aihec.org/), of which all TCUs belong. Data and inclusion of TCUs for this report is based on TCU designation in IPEDS.3520 U.S. Code § 1059e
Non-Minority-Serving Institutions
Any institution that does not have an MSI status is included in the non-MSI category for comparison purposes.
Predominantly Black Institutions (PBI)
PBIs enroll at least 40% Black students and are not HBCUs. They receive designation and funding to be used on activities that serve “more low- and middle-income Black American students”.36See CUPA-HR Survey FAQs.
Although we include PBIs in several general analyses in this report, they are excluded from more specific analyses due to low response rates in CUPA-HR data (n < 5 per survey) and requirements to meet Department of Justice Safe Harbor Guidelines.37 Though AANAPISIs also have low response rates (7-8 institutions per survey), the responding institutions still represent over a third of the total AANAPISI population and thus remain in the analyses.