
The Development, Fundraising, and Alumni Relations Workforce in Higher Education
By Sarah Nadel-Hawthorne, Anthony Schmidt, and Jacqueline Bichsel | April 2022
Introduction
Development, fundraising, and alumni relations offices have been in existence since 1821, when the first alumni association was founded at Williams College, followed by the first alumni fund, which originated at Brown University in 1823.1Sailor, R. W. (1930). The American Alumni Council. The Journal of Higher Education, 1(6), 339-341. doi: 10.2307/1974320. Since then, institutions all over the world have developed and maintained these offices to further advance their institution, alumni, faculty, and students.
Higher education institutions rely on support from donors to improve and sustain the institution. Employees within development, fundraising, and alumni relations, hereafter referred to as fundraising employees, play a pivotal role in securing vital funding through connections and support from alumni. In addition, they help fulfill the university’s philanthropic mission by creating educational opportunities, building relationships, and providing academic opportunities for students.2Snijders, I., Wijnia, L., Rikers, R. M. J. P., & Loyens, S. M. M. (2019). Alumni Loyalty Drivers in Higher Education. Social Psychology Education, 22, 607-627. doi: 10.1007/s11218-019-09488-4 As a result of state budget cuts and tuition increases, the need for student financial assistance, student scholarships, and financial assistance to the institution itself is now more crucial than ever.3Mitchell, M., Leachman, M., & Saenz, M. (2010, October 24). State Higher Education Funding Cuts Have Pushed Costs to Students, Worsened Inequality. Center on Budget and Policy Priorities.
In this report, we define the roles of fundraising employees, examine the typical makeup of fundraising employees based on institutional classification, and present information on salaries of fundraising employees. We then explore retention aspects, examining median number of years in position and age of fundraising employees. Next, we examine the diversity and pay equity of women and minorities in fundraising employee positions. Lastly, we discuss conclusions that will guide higher ed in addressing fundraising employee retention issues.
“The importance of fundraising employees lies in fostering communications and connections of institutional alumni to provide meaningful experiences and opportunities (both philanthropic and non-philanthropic), not only for themselves, but to help improve the lives of current and prospective students as well as faculty. Connecting meaningfully with alumni can inspire them to assist others with life-changing resources, scholarships, and experiences that will impact their lives, not just while at the University of Tennessee, but throughout their journey after graduation.” – Jessy Lawrence, Senior Director of Advancement Communications, University of Tennessee, Knoxville
Fundraising Employees by Position and Category
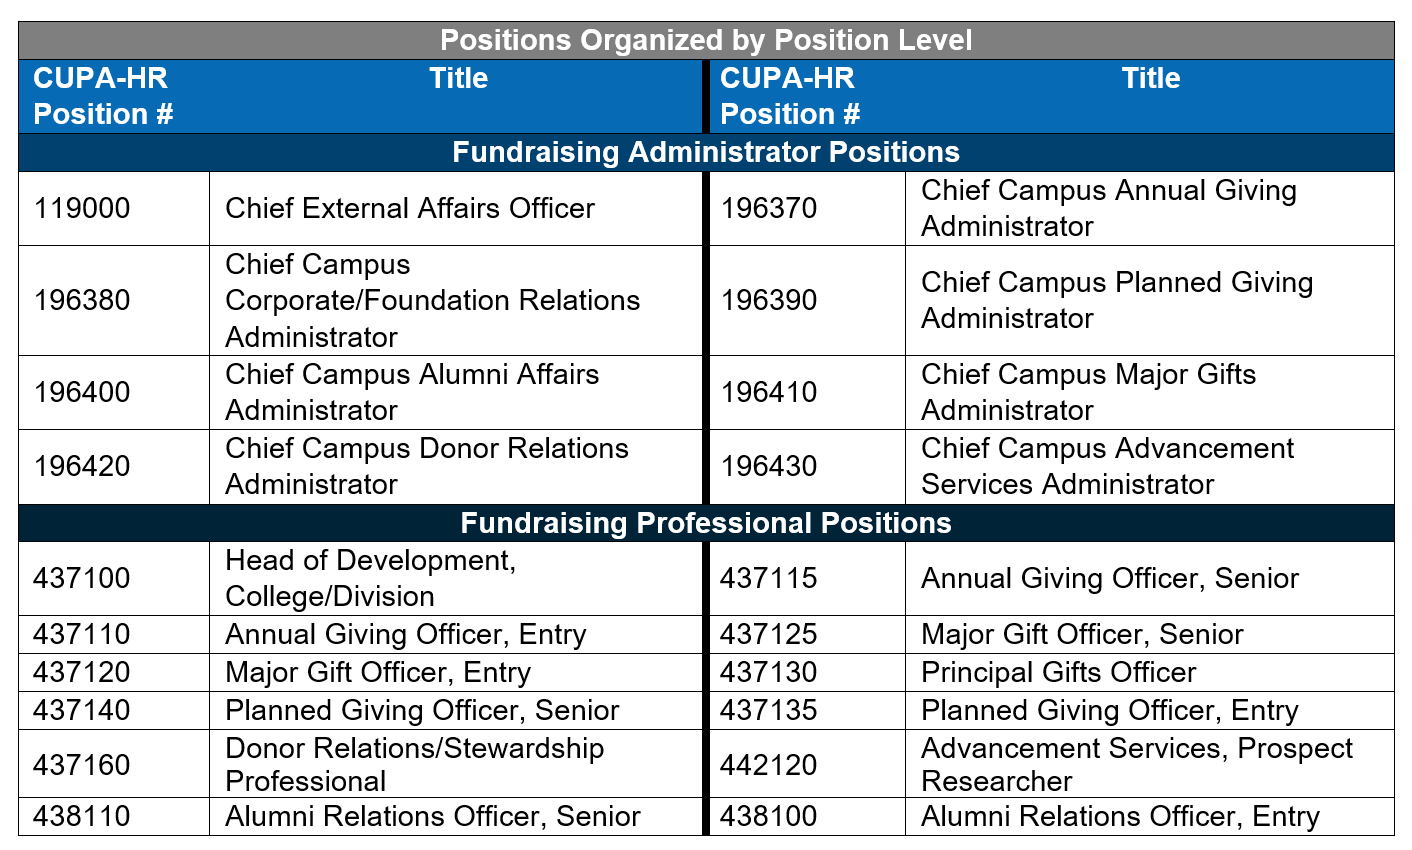
CUPA-HR collects salary and demographic data on 20 fundraising employee positions, both administrative and professional (Table 1).4For detailed descriptions of these positions, see CUPA-HR’s Administrators Survey Participation and Information Template and Professionals Survey Participation and Information Template.
Table 1. Fundraising Employee Positions Organized by Position Level
Staffing of Fundraising Employees by Classification
Typically, 8% of alumni give back financially to their alma mater.5Moody, J. (2020, December 8). 10 Colleges Where the Most Alumni Donate. U.S. News. To build and sustain connections with alumni that help drive financial support, appropriate staffing numbers of fundraising employees is imperative. Fundraising employees consist of fundraising administrators (21%) and fundraising professionals (79%). Figure 1 demonstrates how the median number of fundraising employees differs by institutional classification, as well as the most common positions for each classification. A median staffing for all higher education institutions is one fundraising administrator and two fundraising professionals.
Doctoral and baccalaureate institutions may have higher numbers of fundraising employees because they place a higher priority on new and continued connections with alumni and other donors that help foster financial support. Alumni giving and other fundraising revenue are part of an institution’s endowment. Endowment funds can be restricted to be used for a particular purpose (e.g., student scholarships) or unrestricted and available for multiple uses including the institution’s operating expenses for programs, services, and salaries.6American Association of University Professors (n.d.). Understanding Institutional Finances. (Article).
Figure 1. Fundraising Employee Composition by Classification and Position
Salaries of Fundraising Employees by Classification
Institutional classification not only affects the staffing of fundraising employees as seen in Figure 1, but it also impacts median salaries (Figure 2). Overall, among fundraising administrators, chief external affairs administrators have the highest median salaries ($168,000) and chief campus annual giving administrators have the lowest ($84,000). Heads of development for colleges/divisions have the highest overall median salaries of fundraising professionals ($100,000), whereas prospect researchers for advancement services have the lowest ($55,000). Doctoral institutions have higher median salaries for all fundraising positions except chief campus annual giving administrators and donor relations/stewardship professionals. For these two positions, associate’s institutions have higher median salaries.7For positions where associate’s institutions have the highest median salary compared to all other institutional classifications, these positions represent only 1% to 3% of fundraising employees across all institutional classifications.
Figure 2. Median Salary of Fundraising Employees by Position and Classification
Retention of Fundraising Employees
Years in Position
Figure 3 shows the percentage of fundraising employees by years in position and position category. Fundraising administrators have a median of five years of service in their position, falling slightly below the years in position median for all higher ed administrative positions (5.5 years).8CUPA-HR Survey of Administrators in Higher Education (2020). Fundraising professionals remain in their position for a median of three years, which is one of the lowest median years in position of all higher ed professionals overall (median = 5 years).9CUPA-HR Survey of Professionals in Higher Education (2020). It is also important to note that most fundraising employees have only been in their position for two to three years.
Figure 3. Percentage of Fundraising Employees by Years in Position and Position Level
The positions of chief campus annual giving administrator and chief campus donor relations administrator have the two lowest median salaries of all fundraising administrators and the lowest median number of years in position. More than one-third (38%) of fundraising professionals serve as an annual giving officer or an alumni relations officer. These positions have two of the lowest salaries of fundraising professionals and they have the lowest median years in position (Figures 2 and 3).
Fundraising employees outside of higher ed work in various industries that continue to grow, such as outpatient care centers, scientific research and development services, and business support services. Industry fundraising employees continue to make higher salaries than those within higher ed.10Searls, D. B. (2009). Ten Simple Rules for Choosing Between Industry and Academia. PLoS Computational Biology, 5(6), 1-4. doi: 10.1371/journal.pcbi.1000388. In examining higher ed fundraising salaries compared to industry fundraising compensation practices, it may be possible to increase fundraising employee retention rates by ensuring salaries are competitive based on higher ed and market data.
Age Distribution
Figure 4 displays the age distribution and median age of fundraising employees. The majority (61%) of fundraising administrators are 35 to 55 years of age. The median overall age of fundraising administrators is 50, which is lower than the overall median age for all higher ed administrators (54).11CUPA-HR Survey of Administrators in Higher Education (2020). Chief campus annual giving administrators have the youngest median age (43), and chief campus planned giving administrators have the oldest median age (57).
Overall, most (55%) fundraising professionals are between 27 to 45 years of age with a median overall age of 42. Annual giving officers have the youngest median age (36), and principal gifts officers have the oldest (51). To combat retention issues of younger fundraising employees, their compensation should meet or exceed their expectations.12Kollmann, T., Stöckmann, C., Kensbock, J. M., & Peschl, A. (2019). What Satisfies Younger Versus Older Employees, and Why? An Aging Perspective on Equity Theory to Explain Interactive Effects of Employee Age, Monetary Rewards, and Task Contributions on Job Satisfaction. Human Resource Management, 59(1), 101-115. doi: 10.1002/hrm.21981 Older fundraising employees also expect to be adequately compensated, but to retain older fundraising employees, they must believe that their job tasks are valuable and important to their employer.13Ibid.
Figure 4. Distribution and Median Ages of Fundraising Employees
Representation and Pay of Fundraising Employees
Figure 5 displays the representation of women in each fundraising position.14The “Other” category includes American Indian/Alaska Native, Native Hawaiian/Pacific Islander, and those of multiple ethnicities. For administrators, the representation of women ranges from 52% of chief external affairs officers to 90% of chief campus donor relations officers. As many fundraising administrative positions serve as the pipeline to the chief external affairs officer, it may be expected that women would be largely represented in this role. However, only half of chief external affairs officers are women, suggesting representation inequalities that may be due to women being passed over for promotions to more senior-level positions.
Inequalities also exist for women of color within fundraising administrator roles. Typically, administrative positions require a graduate degree. In 2019, 16% of graduate degree holders were women of color.15Ruggles, S., Flood, S., Goeken, R. Grover, J., Meyer, E., Pacas, J., & Sobek, M. (2020). IPUMS USA: Version 10.0 [dataset]. https://doi.org/10.18128/D010.V10.0 However, women of color only represent 4% to 8% of fundraising administrators, showing a clear opportunity to increase diversity and inclusion efforts within these positions.
Fundraising professional positions help pave the way for women to step into fundraising administrator roles. In professional positions, women’s representation ranges from 58% of principal gifts officer and major gift officer to 85% of donor relations/stewardship professionals (Figure 5). Professional positions typically require a bachelor’s degree, and as of 2019, 16% of bachelor’s degree holders were women of color.16Ibid. Their representation is less than 16% for each professional role, showing there is room for improvement in the representation of women of color in these positions.
Figure 5. Representation of Female Fundraising Employees
Figure 6 displays the median pay ratios of female fundraising administrators and professionals in each fundraising position.17Median pay ratio calculations control for position. For the overall pay ratio, median salaries by sex and race/ethnicity for each specific position were obtained; then the median of those medians was calculated. For pay ratios by administrative or professional area, median salaries by sex and race/ethnicity for each specific position were obtained; then the median of those medians was calculated for each administrative or professional area. This controls for the fact that women and racial/ethnic minorities are represented differently in specific positions that may pay higher or lower salaries, and it means that the wage gaps present are not explained by the fact that women or racial/ethnic minorities have greater representation in lower- or higher-paying positions. Pay ratios vary depending on position and race/ethnicity. Asian women are paid significantly more than White males among chief campus planned giving administrators ($1.78 for every $1.00 paid to White males), and chief campus advancement services administrators ($1.27 for every $1.00 paid to White males). In addition, Black female chief campus planned giving administrators are paid $1.46 for every $1.00 that White males are paid. On the other hand, among chief campus alumni affairs administrators, Hispanic women are paid only $0.78 for every $1.00 paid to White males. White female chief campus donor relations administrators are also paid only $0.78 for every $1.00 paid to White males.
Within professional positions, Asian women who are heads of development in colleges/divisions are paid $1.26 for every $1.00 White males are paid. However, Black female planned giving officers are paid only $0.79 for every $1.00 White males are paid. Hispanic women are paid significantly less than White males among principal gifts officers ($0.73 for every $1.00 paid to White males) and among donor relations/stewardship professionals ($0.81 for every $1.00 paid to White males).
Figure 6. Pay Ratios of Female Fundraising Employees
Figure 7 demonstrates the representation of all minority fundraising employees in each fundraising position.18The “Other” category includes American Indian/Alaska Native, Native Hawaiian/Pacific Islander, and those of multiple ethnicities. The highest representation of minority fundraising administrators is found among chief external affairs officers (12%), and the lowest representation is in chief campus planned giving administrators (4%). The highest representation of minority fundraising professionals is among planned giving officers (18%), and the lowest representation is among principal gifts officers (9%).
Most administrative positions require a graduate degree, and 29% of graduate degree holders across the United States in 2019 were minorities.19Ruggles, S., Flood, S., Goeken, R. Grover, J., Meyer, E., Pacas, J., & Sobek, M. (2020). IPUMS USA: Version 10.0 [dataset]. https://doi.org/10.18128/D010.V10.0 Professional positions typically require a bachelor’s degree, and 29% of bachelor’s degree holders across the United States in 2019 were minorities.20Ibid. As only 12.3% of all fundraising positions, both administrative and professional, are held by minority incumbents, there is a clear opportunity for diversity improvements within fundraising positions.21CUPA-HR Survey of Administrators in Higher Education (2020) and CUPA-HR Survey of Professionals in Higher Education (2020).
Figure 7. Representation of Racial/Ethnic Minority Fundraising Employees
Figure 8 displays the median pay ratios of all minority fundraising employees in each fundraising position.22Median pay ratio calculations control for position. For the overall pay ratio, median salaries by race/ethnicity for each specific position were obtained; then the median of those medians was calculated. For pay ratios by professional area, median salaries by race/ethnicity for each specific position were obtained; then the median of those medians was calculated for each professional area. This controls for the fact that racial/ethnic minorities are represented differently in specific positions that may pay higher or lower salaries, and it means that the wage gaps present are not explained by the fact that racial/ethnic minorities have greater representation in lower- or higher-paying positions. Asian chief campus planned giving administrators are paid much more than White males ($1.68 for every $1.00 White males are paid), whereas Asian chief external affairs administrators are paid much less than White males ($0.86). Black chief campus planned giving administrators are paid much more than White males ($1.38). Hispanic chief campus advancement services administrators are paid $1.15 for every $1.00 White males are paid, and Hispanic chief campus corporate/foundations relations administrators are paid only $0.76 for every $1.00 White males are paid.
In professional positions, Asians are paid more than White males in all professional positions. Black prospect researchers for advancement services are paid $1.09 for every $1.00 White males are paid, whereas Black planned giving officers are paid only $0.92. Hispanic donor relations/stewardship professionals are paid only $0.84 for every $1.00 White males are paid. In sum, there is wide variation in the pay of racial/ethnic minorities in fundraising positions.
Figure 8. Pay Ratios of Black, Hispanic/Latinx, and Asian Fundraising Employees
Conclusions
Fundraising employees help achieve the institution’s missions and goals through fundraising, donations, educational opportunities, fostering of relationships, and providing various academic opportunities to faculty, staff, and students. Key take-aways from this report include:
- Doctoral institutions have the largest number of fundraising employees, followed by baccalaureate institutions. Associate’s institutions typically have only one fundraising employee.
- Salaries are affected by institutional classification. Doctoral institutions pay the highest median salary for the majority of fundraising positions compared to all other institutional classifications.
- The median tenure (years in position) and median age of fundraising employees are lower than for other higher ed staff. This may indicate issues with retention for these staff.
- Women overall are well-represented in fundraising positions, but they are paid less than White men. People of color are underrepresented in fundraising employees.
About the Authors:
Sarah Nadel-Hawthorne, Ph.D., is a former survey researcher at CUPA-HR and is now a senior consultant at Gallup.
Anthony Schmidt, M.S.Ed., is a former data visualization researcher at CUPA-HR and is now a data scientist at Amplify.
Jacqueline Bichsel, Ph.D., is director of research at CUPA-HR.
Citation for This Report:
Nadel-Hawthorne, Sarah; Schmidt, Anthony; & Bichsel, Jacqueline. (2022, April). The Development, Fundraising, and Alumni Relations Workforce in Higher Education (Research Report). CUPA-HR.