
Faculty in the Health Professions
By Melissa Fuesting and Anthony Schmidt | May 2020
Introduction
The U.S. population is aging. In 2010, approximately 13% of the U.S. population was over age 65. By 2030, over 20% of the U.S. population is projected to be over age 65.1Ortman, J.; Velkoff, V.; & Hogan, H. (2014). An Aging Nation: The Older Population in the United States (Research Report). United States Census Bureau.
The aging of the U.S. population will impact the nation in numerous ways, but one central projection is that the U.S. will require more health professionals to care for its aging population in the future.2Bureau of Labor Statistics (2019). Employment Projections 2018-2028 (USDL-19-1571). Sixteen of the projected top 30 fastest growing occupations are health and health-related professions that require postsecondary training.3Ibid. ,4Bureau of Labor Statistics (2019). Occupational Outlook Handbook. Health professions faculty will play a crucial role in helping prepare future health professionals to provide care for the aging U.S. population.
This brief explores the state of the full-time health professions faculty workforce5Data are sourced from the 2014 through 2019 CUPA-HR Faculty in Higher Education Survey. Our analyses focus on data from 300 four-year institutions that consistently reported at least one health professions faculty position from 2014 to 2019. For the purposes of this brief, health professions faculty positions are positions coded as Classification of Instructional Program (CIP) Code 51. Throughout this report, we exclude postdoctoral scholar positions from analyses. by examining:
- overall growth in the number of full-time health professions faculty relative to all other disciplines6Discipline refers to 2-digit CIP codes. ;
- the percentage of full-time positions that are non-tenure-track versus tenure-track;
- faculty composition in the health professions compared to all other disciplines and faculty composition within health professions subdisciplines7Subdiscipline refers to 4-digit CIP codes. ; and
- health professions faculty compensation.
Growth in Health Professions Faculty
From 2014 to 2019, the number of health professions faculty increased by 19%, whereas the number of faculty in all other disciplines increased by 6%.8We examine workforce changes from 2014 to 2019 because 2014 was the first year where data were available on both tenure-track and non-tenure-track faculty, thus allowing comparisons of how composition has changed over time. Institutions added a median of four health professions faculty during this period, and 75% of institutions added at least one health professions faculty position. Most growth in the health professions occurred between 2015 and 2017. Figure 1 shows the percentage increase in positions and the total number of positions by tenure type and year in the health professions and all other disciplines.
Overall growth in health professions faculty is likely related to the continually growing demand for higher education in the health professions — from 2014 to 2017, growth in bachelor’s degree awards in the health professions (20% increase) outpaced growth in all other disciplines (3% increase)9U.S. Department of Education, National Center for Education Statistics (2018). Digest of Education Statistics: 2017 (NCES 2018-070). .
Most of the gains in full-time health professions faculty positions occurred through the addition of non-tenure-track positions. From 2014 to 2019, the number of tenure-track health professions positions increased by 5%, and the number of non-tenure-track health professions positions increased by 37%. The percentage increase in non-tenure-track positions in the health professions from 2014 to 2019 is similar to the percentage increase in non-tenure-track positions in all other disciplines. From 2014 to 2019, the health professions gained tenure-track positions, while all other disciplines lost tenure-track positions.
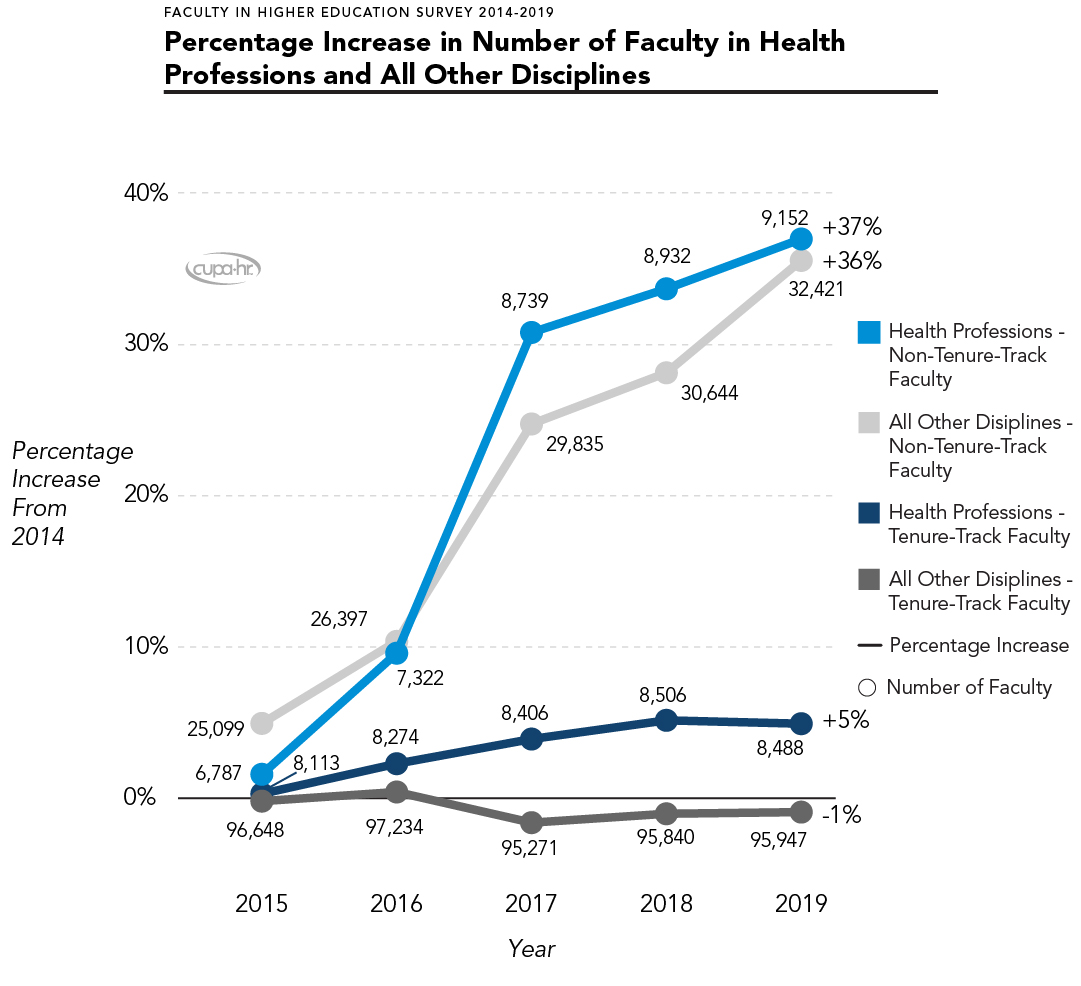
Figure 1. Percentage Increase in Number of Faculty in Health Professions and All Other Disciplines
Growth in Tenure-Track and Non-Tenure-Track Faculty
by Discipline
Health professions joined many other disciplines that gained a higher percentage of non-tenure-track positions than tenure-track positions from 2014 to 2019 (Figure 2)10To ensure adequate sample size, Figure 2 includes disciplines that reported at least 100 tenure-track and 100 non-tenure-track positions in 2014. . Note that the health professions gained both tenure-track and non-tenure-track positions from 2014 to 2019, but tenure-track positions in many disciplines decreased during this time period.
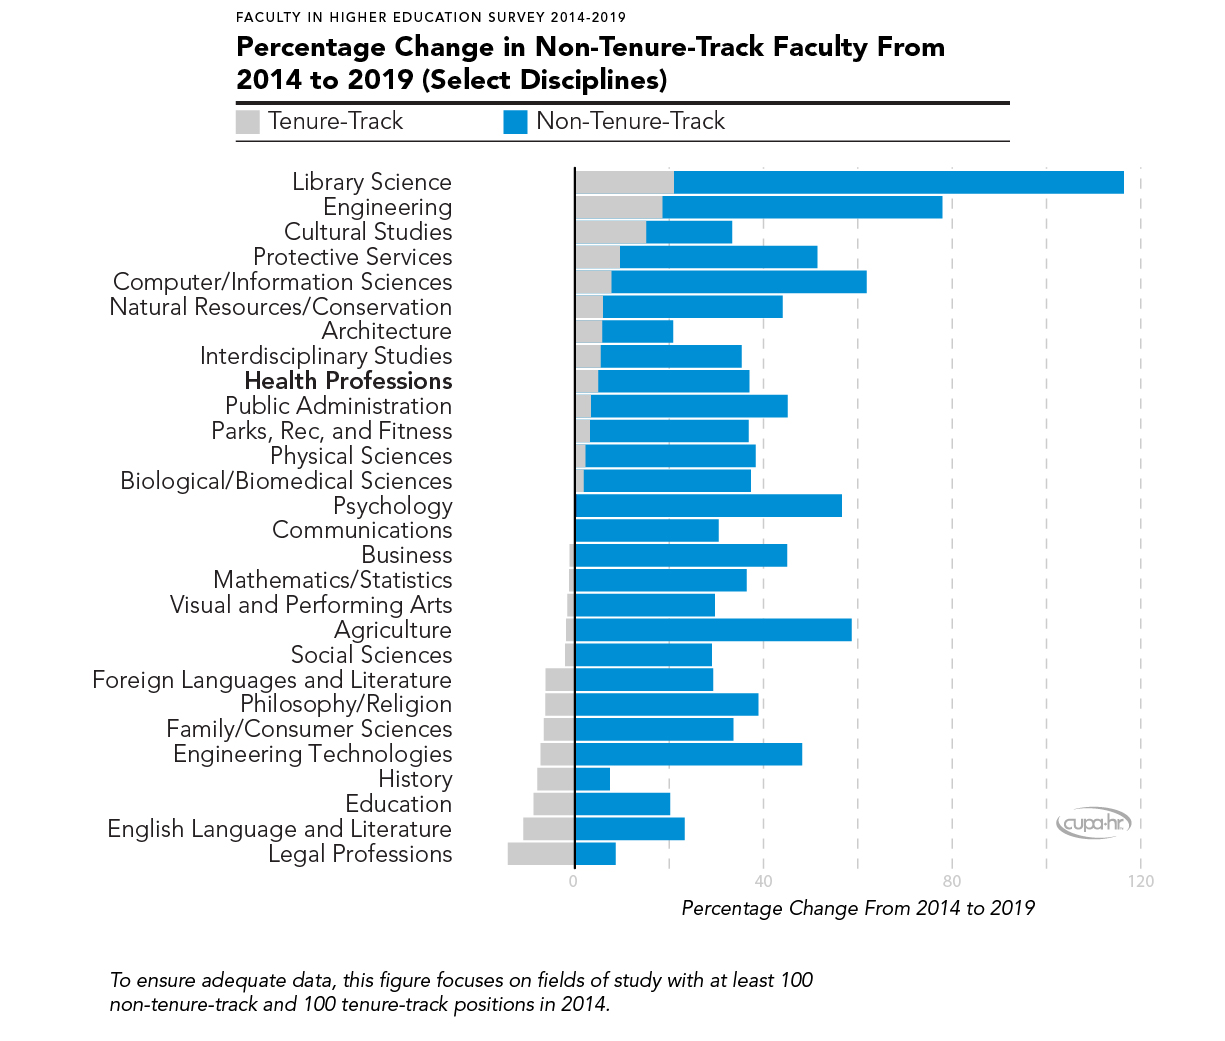
Figure 2. Percentage Change in Non-Tenure-Track Faculty From 2014 to 2019 (Select Disciplines)
Faculty Composition by Discipline
Faculty composition in the health professions differs in important ways from faculty composition in other disciplines. Half of health professions faculty have been non-tenure-track for the past six years, increasing from 45% to 52% from 2014 to 2019 (Figure 3). The percentage of full-time faculty positions that were non-tenure-track was twice the size in health professions than in all other disciplines from 2014 to 2019. Currently, more than half (52%) of health professions faculty are non-tenure-track, compared to one-fourth (25%) of faculty in all other disciplines.
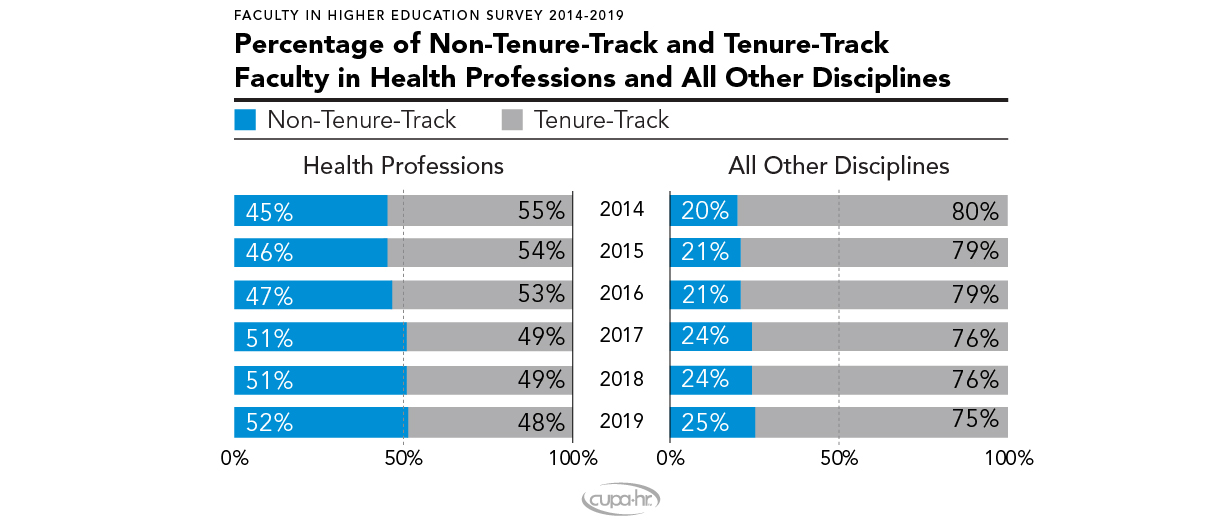
Figure 3. Percentage of Non-Tenure-Track and Tenure-Track Faculty in Health Professions and All Other Disciplines
Health Professions Faculty Composition by Institutional Classification
Faculty composition varies by institutional classification (Figure 4). Most full-time health professions faculty at doctoral institutions are non-tenure-track, but most full-time health professions faculty at master’s and baccalaureate institutions are tenure-track.
Some differences in health professions faculty composition by classification are due to differences in the numbers of non-tenure-track research positions. Such positions are nonexistent at baccalaureate institutions and extremely rare at master’s institutions, but common at doctoral institutions.
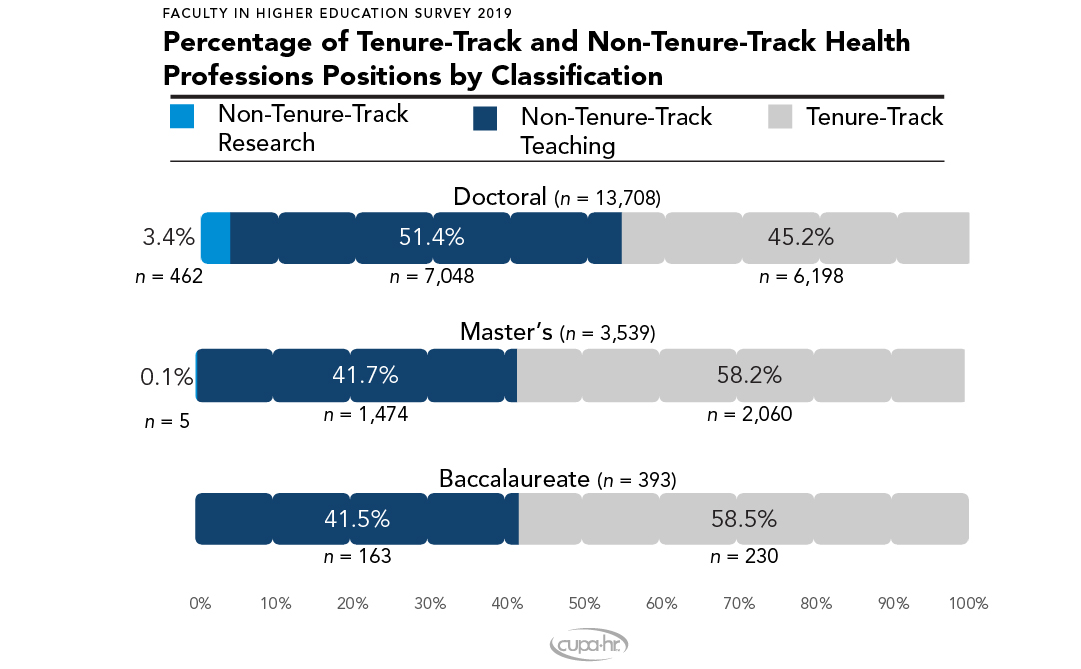
Figure 4. Percentage of Tenure-Track and Non-Tenure-Track Health Professions Positions by Classification
Faculty Composition by Subdiscipline
Another factor that contributes to today’s higher concentration of health professions non-tenure-track positions than tenure-track positions at doctoral universities is that almost all positions in medicine and dentistry, which lean heavily non-tenure-track, are at doctoral universities.
Though the overall health professions faculty workforce is mostly non-tenure-track, considerable variations exist among health professions subdisciplines.11Figure 5 includes only subdisciplines with at least 100 positions in 2019. Four subdisciplines within the health professions — medicine, dentistry, allied health, and nursing — have more non-tenure-track than tenure-track faculty, whereas other subdisciplines are either balanced between tenure-track and non-tenure-track positions (i.e., laboratory science) or are mostly tenure-track.12Subdiscipline refers to 4-digit CIP codes.
Higher concentrations of non-tenure-track faculty in medicine and dentistry may reflect more modern compensation practices that allow faculty to conduct private practice in addition to their academic appointment. Higher concentrations of non-tenure-track faculty in medicine and dentistry also reflect decades-long increases in the proportion of faculty in these fields who hold clinician-educator positions. Clinician-educator positions are typically non-tenure-track and emphasize excellence in teaching and clinical practice over basic research and obtaining external funding. Conducting research, and clinical research in particular, can still be an important aspect of these positions, but basic science is usually less emphasized than in tenure-track positions. The proportion of clinician-educator positions continues to grow, perhaps for two reasons: 1) they do not require faculty to achieve excellence in all three areas of research, teaching, and practice; and 2) these positions can also provide revenue for institutions through the delivery of clinical services.13Costello, B.J.; Marshall, K.L.; Schafer, T.; Phillips, S.; & Hart, T.C. (2013). The Utility of Hybrid Promotion and Tenure Tracks for Dental School Faculty. Journal of Dental Education, 77, 706-715. PMID: 23740907 , 14Steinmann, A.F.; Dy, N.M.; Kane, G.C.; Kennedy, J.I.; Silbiger, S.; Sharma, N.; & Rifkin, W. (2009). The Modern Teaching Physician – Responsibilities and Challenges: An APDIM White Paper. The American Journal of Medicine, 122, 692-697. doi: 10.1016/j.amjmed.2009.03.020 , 15Barchi, R.L., & Lowery, B.J. (2000). Scholarship in the Medical Faculty From the University Perspective: Retaining Academic Values. Academic Medicine, 75, 899-905. doi: 10.1097/00001888-200009000-00011
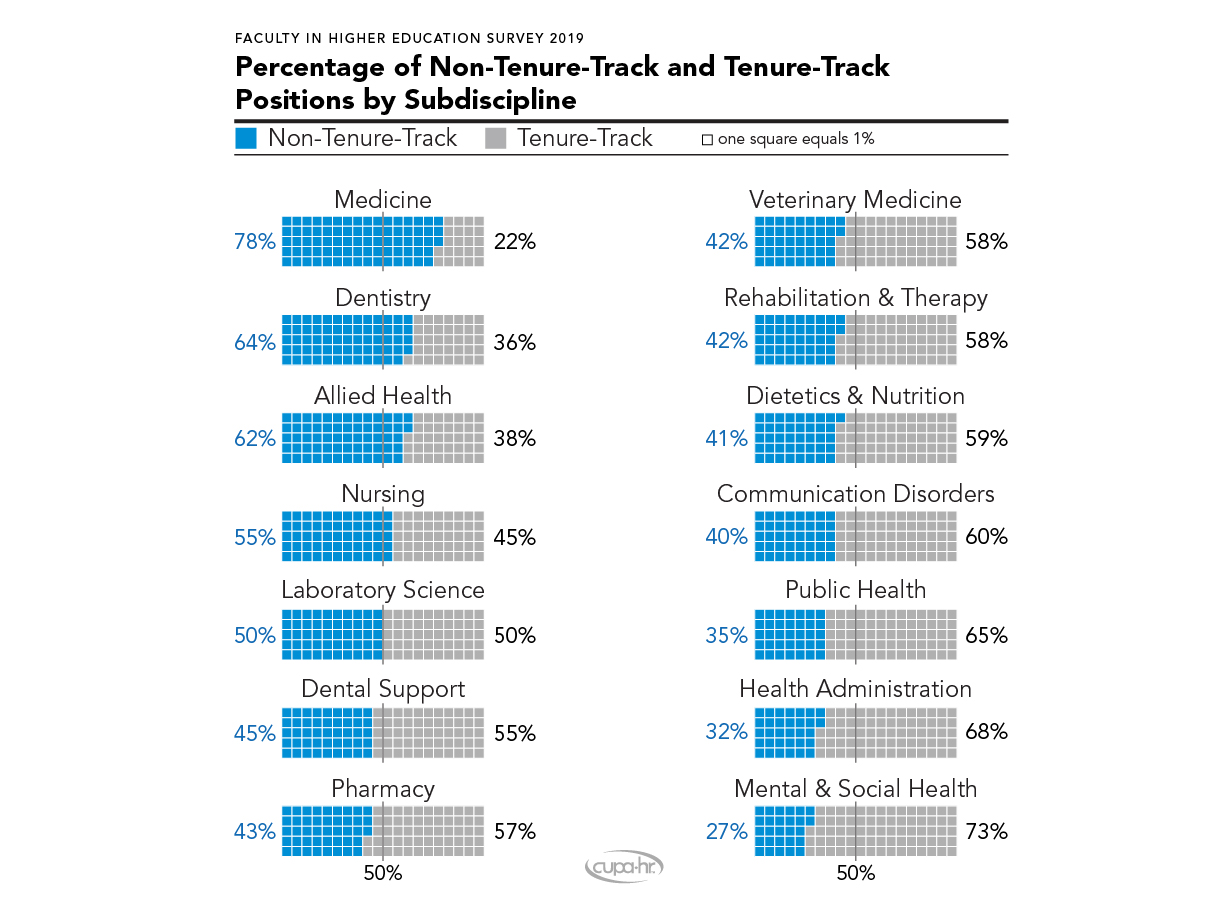
Figure 5. Percentage of Non-Tenure-Track and Tenure-Track Positions by Subdiscipline
Health Professions Faculty Salaries
Tenure status impacts the median salary for health professions faculty (Figure 6). Tenure-track faculty are paid a considerably higher median salary than are non-tenure-track faculty. The median salary of tenure-track faculty is 10% greater than that of non-tenure-track teaching faculty and 13% greater than that of non-tenure-track research faculty.16Note that it is not uncommon for full-time health professions faculty to have clinical duties in addition to faculty duties that may provide separate, additional compensation.
Percentage differences in median salary by tenure status are smaller in the health professions in comparison to all other disciplines, where tenure-track positions are paid 41% more than non-tenure-track teaching faculty and 27% more than non-tenure-track research faculty.
The relative pay of non-tenure-track teaching and non-tenure-track research positions differs in the health professions compared to all other disciplines. In the health professions, non-tenure-track teaching faculty are paid 4% more than non-tenure-track research faculty; in all other disciplines, non-tenure-track teaching faculty are paid 13% less than non-tenure-track research faculty.

Figure 6. Median Salaries of Health Professions Faculty Compared to Faculty in All Other Disciplines
Summary and Next Steps
From 2014 to 2019, the number of full-time health professions faculty positions increased faster than faculty in all other disciplines combined, with most of the growth occurring between 2015 and 2017. Most of the increase in full-time health professions faculty positions occurred through the addition of non-tenure-track positions. Health professions joined many other disciplines that added higher percentages of non-tenure-track than tenure-track positions from 2014 to 2019.
Faculty composition in the health professions versus all other disciplines was unique in two ways. First, from 2014 to 2019, the share of full-time positions in the health professions that were non-tenure-track was approximately double the share of full-time positions in all other disciplines that were non-tenure-track. Second, in 2014, 45% of full-time faculty positions in health professions were non-tenure-track. By 2019, 52% of full-time faculty positions in health professions were non-tenure-track, whereas all other disciplines were approximately 25% non-tenure-track.
Relative to master’s and baccalaureate institutions, doctoral institutions reported a higher concentration of health professions non-tenure-track positions, in part because almost all positions in medicine and dentistry, which lean heavily non-tenure-track, are at doctoral universities. Differences due to subdiscipline emerge in faculty composition. Positions in medicine, dentistry, allied health, and nursing are mostly non-tenure-track, and positions in all other subdisciplines are either balanced between tenure-track and non-tenure-track or are mostly tenure-track.
Health professions non-tenure-track positions are paid lower median salaries than are tenure-track positions, but the difference is not as great as in other disciplines.
In considering the results of this brief, higher education leaders should consider the following:
- Compare these data with data at your own institution. Are the hiring patterns of your institution similar or different?
- If the number of full-time health professions faculty positions continues to grow, what are your plans to recruit new faculty and retain current faculty in an increasingly competitive marketplace?
- Many institutions create health professions faculty contracts with provisions that enable the faculty member to maintain some form of private practice. Does your institution frequently review practices across the country to ensure that your institution’s contracting and compensation practices are competitive?
- Do you view current students as a future pipeline for faculty positions? If not, how might you incorporate this into your strategy for ensuring an adequate health professions faculty workforce for the future?
Citation for this report: Fuesting, Melissa, & Schmidt, Anthony. (2020, May). Faculty in the Health Professions: Growth, Composition, and Salaries (Research Report). CUPA-HR.
Printer-friendly Version 1 Ortman, J.; Velkoff, V.; & Hogan, H. (2014). An Aging Nation: The Older Population in the United States (Research Report). United States Census Bureau.