
The Challenges of an Aging Higher Ed Workforce
This report was made possible with the support of
![]()
By Adam Pritchard, Jingyun Li, Jasper McChesney, and Jacqueline Bichsel | August 2019
Introduction
The population of the United States is getting older. According to the U.S. Bureau of Labor Statistics (BLS), older workers — which the BLS defines as those who are 55 and older — made up 22% of the U.S. workforce in 2016, nearly double the 12% recorded in 1995.1Toossi, M., & Torpey, E. (2017, May). Older Workers: Labor Force Trends and Career Options. U.S. Department of Labor, Bureau of Labor Statistics. This increase is largely “fueled by the aging baby-boom generation, a large group of people born between 1946 and 1964” (currently aged 55 to 73).2Ibid. As baby boomers approach retirement age and exit the workforce in the coming decade, they will be followed by Generation X — a generation that’s nearly 30% smaller.3Fry, R. (2018, March). Millennials Projected to Overtake Baby Boomers as America’s Largest Generation. Pew Research Center. For HR professionals, these facts present challenges such as salary compression and a shrinking domestic talent pool for key positions in the future.
This brief focuses on the implications of the aging staff workforce in higher education, specifically professionals and non-exempt staff.4Salary and demographic data for higher education professionals and non-exempt staff are sourced from the 2019 CUPA-HR Professionals in Higher Education Survey and Staff in Higher Education Survey. Data include 446,844 staff in 540 different positions. Annualized salary data were collected and standardized according to procedures set forth in the Professionals and Staff Survey Participation and Information Templates. We analyze the age distribution of higher ed staff, identify the job areas with the largest aging workforce, examine pay equity for women and men with varying levels of experience, and highlight the higher ed staff positions where salary compression is the most common.
Age Distribution of Staff
The median age for all higher ed staff is 45. In the overall U.S. workforce, the median age is 42.5U.S. Department of Labor, Bureau of Labor Statistics. (2018). Employed Persons by Detailed Industry and Age (Table 18b). Figure 1 shows the percentage of employees in each age group among the higher ed staff workforce compared to the U.S. workforce overall. There is a much smaller percentage of younger employees (under 25) and a larger percentage of older employees (over 55) in higher ed than in the overall U.S. workforce. Employees who are 55 years old and older make up almost one-third (29%) of the higher ed staff workforce, whereas less than one-fourth (23%) of the U.S. workforce is over 55.6Ibid. Higher ed already has more older employees than the projected U.S. labor force share of 25% by 2024.7U.S. Department of Labor, Bureau of Labor Statistics. (2015, December). Labor Force Projections to 2024: The Labor Force Is Growing, But Slowly (Article). Since higher ed has a greater share of older workers than other industries, it may need to act to address the challenges of an aging workforce much sooner.
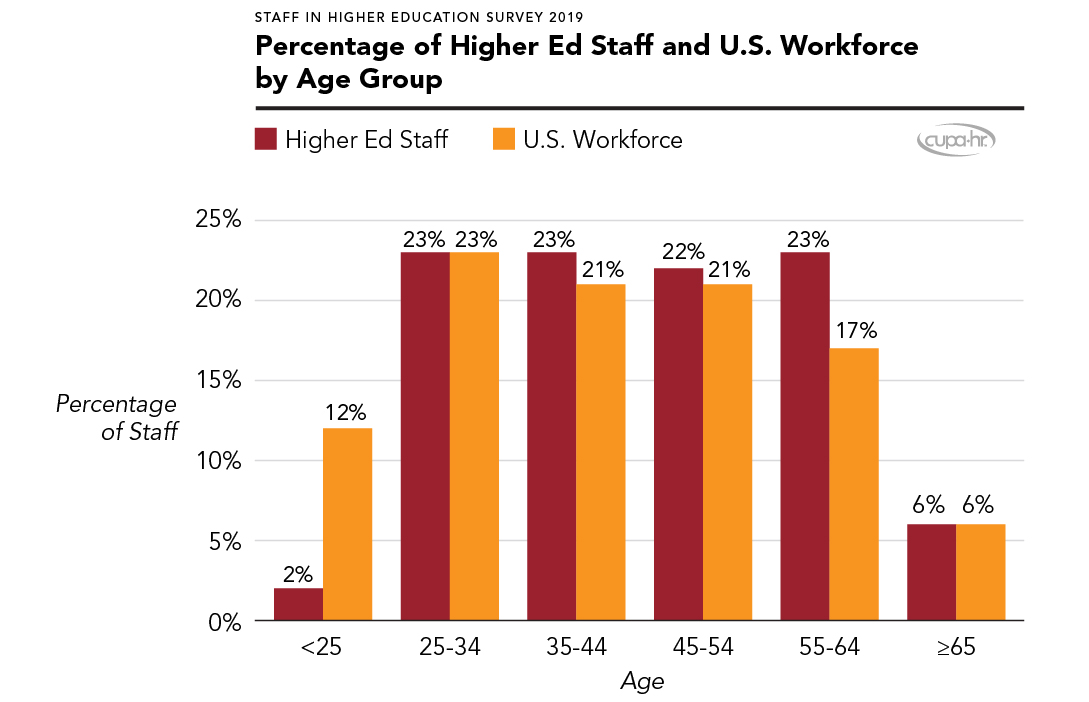
Figure 1. Percentage of Higher Ed Staff and U.S. Workforce by Age Group
Job Areas With More Older Workers
Historically, high school students in the U. S. were routinely taught vocational skills. In the 1980s, American education systems started to shift the focus to academics and to preparing all students for college.8Jacob, B. (2017, October). What We Know About Career and Technical Education in High School (Report). Brookings. Since then, fewer students have been exposed to career options in the skilled crafts. We may be seeing the impact of this change in higher ed staff data. Figure 2 shows that skilled craft, facilities, and service/maintenance areas have the highest percentages of older workers, each with nearly 40% or more of its workforce over 55 years old.
Higher ed institutions may soon have a difficult time competing for new employees to fill these positions. The gap between the jobs that need to be filled and the skilled talent pool will leave an estimated 2.4 million positions unfilled between 2018 and 2028 in the U.S. manufacturing sector
alone.9Giffi, C.; Wellener, P.; Dollar, B.; Manolian, H.; Monck, L.; & Moutray, C. (2018). 2018 Skills Gap in Manufacturing Study; Future of Manufacturing: The Jobs Are Here, But Where Are the People? (Report). Deloitte.
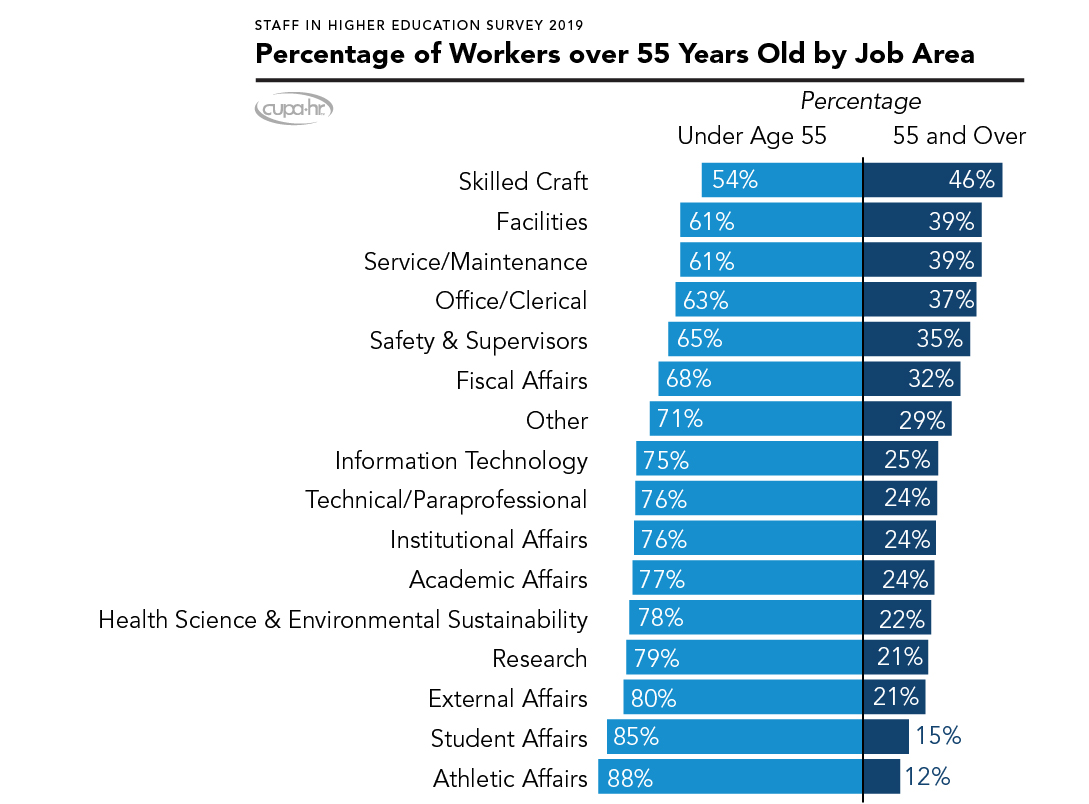
Figure 2. Percentage of Workers Over 55 Years Old by Job Area
Women’s Pay Equity
Figure 3 shows the median salary for male and female staff based on the number of years they’ve been in their current position, as well as the ratio of women’s to men’s salaries over the same timeframe. Whereas salaries for men show a steady increase with years in position, salaries are largely the same for women with between 8 and 22 years in their position. This suggests that when women stay in the same job long term, their pay increases consistently fall short of raises paid to men.
Pay inequity for women has a dramatic, cumulative effect over a higher ed staff employee’s career. Newly hired staff are paid nearly equitably; women are paid a median salary of $45,000, and men are paid $45,410, resulting in a female/male pay ratio of $0.99.10Median pay ratios are controlled for position. Median salaries by sex for each specific position were obtained; then the median of those medians was calculated for both men and women for each position area. This controls for the fact that women are represented differently in specific positions that may pay higher or lower salaries than other positions, and it means that the wage gaps present are not explained by the fact that women have greater representation in lower-paying positions. However, the pay gap widens with increases in years in position. At 20 years, women are paid only $0.86 to every $1.00 paid to men. In terms of annual salary, with 10 years in a position, women are paid $4,000 less than men. With 20 years in a position, women are paid $8,000 less than men. Over all 20 years, the cumulative annual pay differences add up to $87,600 — and this figure does not include the benefits of retirement matching and potential investment growth over time.

Figure 3. Salary and Pay Ratio by Sex and Years in Position
Positions With Salary Compression
Figure 4 highlights the higher ed staff positions for which more than 30% of institutions pay new hires the same or more than the median salary of their longer-serving employees in the same position.11A total of 677 institutions reported positions with both new hires and existing employees and were analyzed for compression when at least 100 institutions reported both new and existing staff. When lower-level or less-experienced employees are paid close to or higher than higher-level employees or employees who have been with an institution for many years in the same job, this is known as salary compression.12Kochanski, J. & Stiles, Y. (2013, July 19). Put a Lid on Salary Compression Before It Boils Over. Sibson Consulting. Many other higher ed staff positions experience salary compression, though less frequently than these positions.
Salary compression occurs when current employee raises don’t keep up with the increases in market pay rate for jobs, and the supply of qualified candidates is low. To attract talent, employers sometimes need to offer new hires salaries higher than those of more senior employees. Salary compression has an adverse impact on employee morale, particularly for long-serving older workers, and may even result in lawsuits related to age discrimination or pay inequity for employees from protected classes.13Ibid.

Figure 4. Top Positions Paying Longer-Serving Employees Equal or Less Than New Hires
Summary
A large part of the overall U.S. workforce is aging, and an even larger part of the higher education staff workforce is following the same trend. With almost one-third (29%) of the higher ed staff workforce over the age of 55, higher education leaders must act to ensure that the pipeline for key positions is adequate to fulfill future staffing needs. Seeking external expertise in a very competitive job market is going to be more challenging, so efforts to prepare staff for internal promotion must become more of the norm.
Preparing for a large part of the workforce nearing retirement means paying special attention to certain key staff areas. In particular, the areas of skilled craft, facilities, and service/maintenance have a large percentage of older workers. In an increasingly competitive job market, higher ed institutions should develop a plan to anticipate and address these highly competitive job shortages.
To address some of the issues posed by an aging workforce, attention to retention is key. For example, for higher education staff, pay equity for women decreases with more time in position. Given the current political climate and increasing awareness of pay inequity, retention of women in staff positions may increase if pay equity issues are addressed proactively.
In addition, several positions in higher education are experiencing salary compression, where newer workers are paid the same or better than longer-serving employees within the same job. Identifying and addressing salary compression issues may also help with retention efforts long-term.
Citation for this report: Pritchard, Adam; Li, Jingyun; McChesney, Jasper; & Bichsel, Jacqueline (2019, August). The Challenges of an Aging Higher Ed Workforce (Research Report). CUPA-HR.
Printer-friendly Version 1 Toossi, M., & Torpey, E. (2017, May). Older Workers: Labor Force Trends and Career Options. U.S. Department of Labor, Bureau of Labor Statistics.