
Representation and Pay of Women of Color in the Higher Education Workforce
This research brief was made possible with the support of

By Jasper McChesney | May 2018
Introduction
In 2017, CUPA-HR published three reports on equity and diversity among higher education administrators. We found that women and ethnic minorities — analyzed separately — continue to face disadvantages regarding representation and pay.1Bichsel, J., & McChesney, J. (2017, February). The Gender Pay Gap and the Representation of Women in Higher Education Administrative Positions: The Century So Far (Research Report). CUPA-HR. Bichsel, J., & McChesney, J. (2017, March). Pay and Representation of Racial/Ethnic Minorities in Higher Education Administrative Positions: The Century So Far (Research Report). CUPA-HR. McChesney, J. (2017, August). The Representation and Pay of Women and Minorities in Higher Education Administration: Institutions That Are Getting It Right (Research Report). CUPA-HR. We were thus prompted to consider the intersection of gender and ethnic minority status and what unique challenges these individuals face throughout the higher education workforce.
“Intersectionality” refers to the combination of discrimination or bias experienced by individuals with overlapping identities, each of which is associated with discrimination on its own. For example, women experience certain biases in the workplace, as do Hispanics; therefore, an Hispanic woman may experience both or a more extreme form of bias.
In this report, we use recent data to examine representation and pay equity for the intersection of two groups: women and individuals who identify as either Black/African American or Hispanic/Latino.2Demographic and salary data were obtained from CUPA-HR’s 2016-17 salary surveys on administrators, four-year faculty, professionals, and staff. The sample of participating institutions is broadly representative of higher education in the U.S. Incumbents with no demographic data were omitted from analyses, as were nonresident aliens (for whom specific ethnicity is not encoded). Our analyses encompass all higher education positions, separated into four broad categories: administrators, faculty, professionals, and (mainly non-exempt) staff. We describe the kinds of inequity women and ethnic minorities experience, how these inequities intersect for women of color, and how inequities differ by position type.
Overall Picture
A common finding of intersectional studies is that individuals in two under-privileged classes face greater inequities than individuals in only one class. This pattern holds true for higher ed employees’ overall pay, as can be seen in Figure 1.3Pay ratio was calculated as the median salary in a group divided by the median salary of White men. Representation was calculated as the percentage of individuals out of the total. In some graphs, representation is compared to the percentages of individuals out of the entire U.S. population, as estimated from U.S. Census figures. See: U.S. Census data, via American Fact Finder. Both minority men and White women are under-paid in comparison to White men, and women of color are paid the least equitably of all — only 67 cents on the dollar.
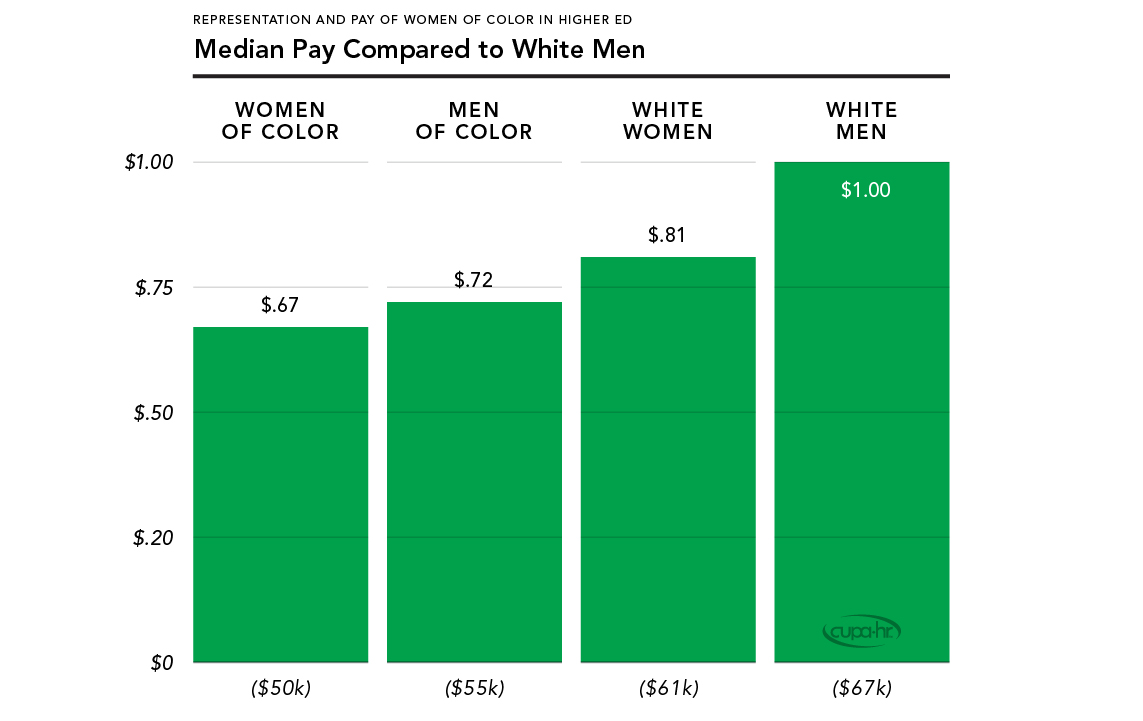
Figure 1. Median Pay Compared to White Men
Figure 2 shows the overall representation of each group in the higher ed workforce. This can be compared to percentage of the U.S. population and percentage of four-year college degree holders. Generally, representation in higher ed roughly tracks the college education numbers. People of color are under-represented among the college educated, and also among higher-ed employees. In contrast, White women are over-represented, even considering their high rates of college attainment.
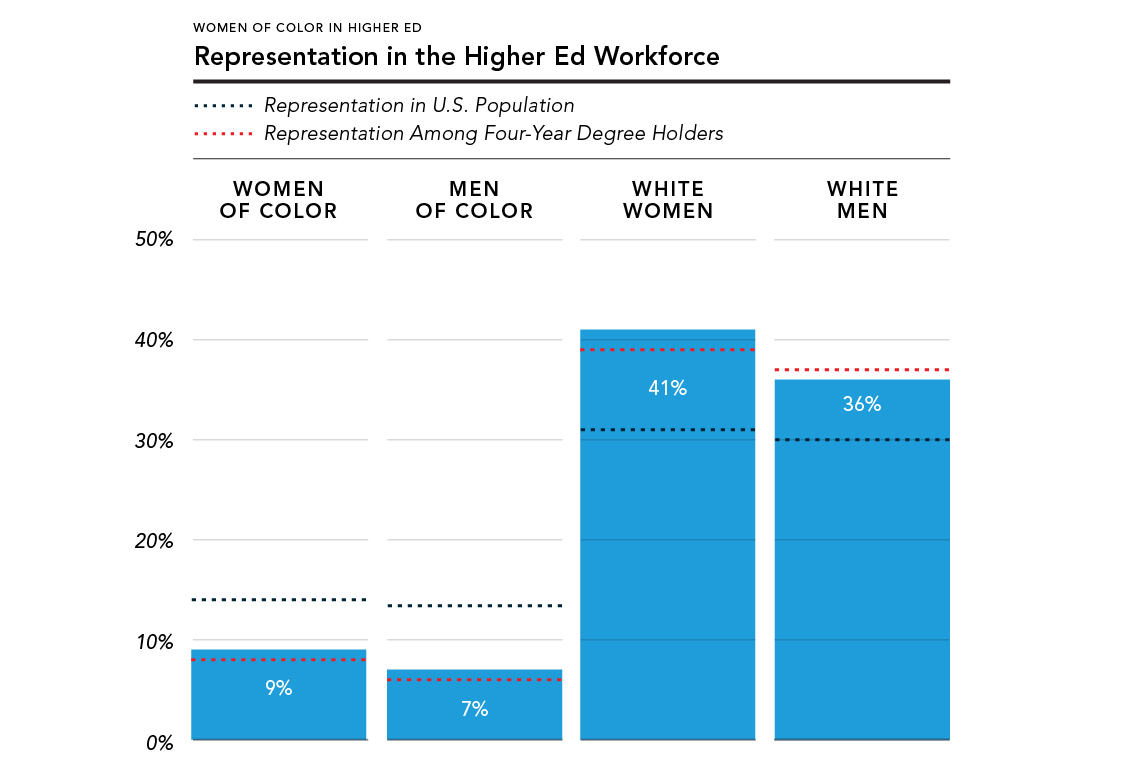
Figure 2. Representation in the Higher Ed Workforce
Pay and Representation by Position Type
Pay Equity
In Figure 3, we see the pay ratio for each demographic group across four types of position groups: administrators, faculty, professionals, and staff. Values are relative to $1.00 of White men’s pay, and the dark reference line represents equity with White men.
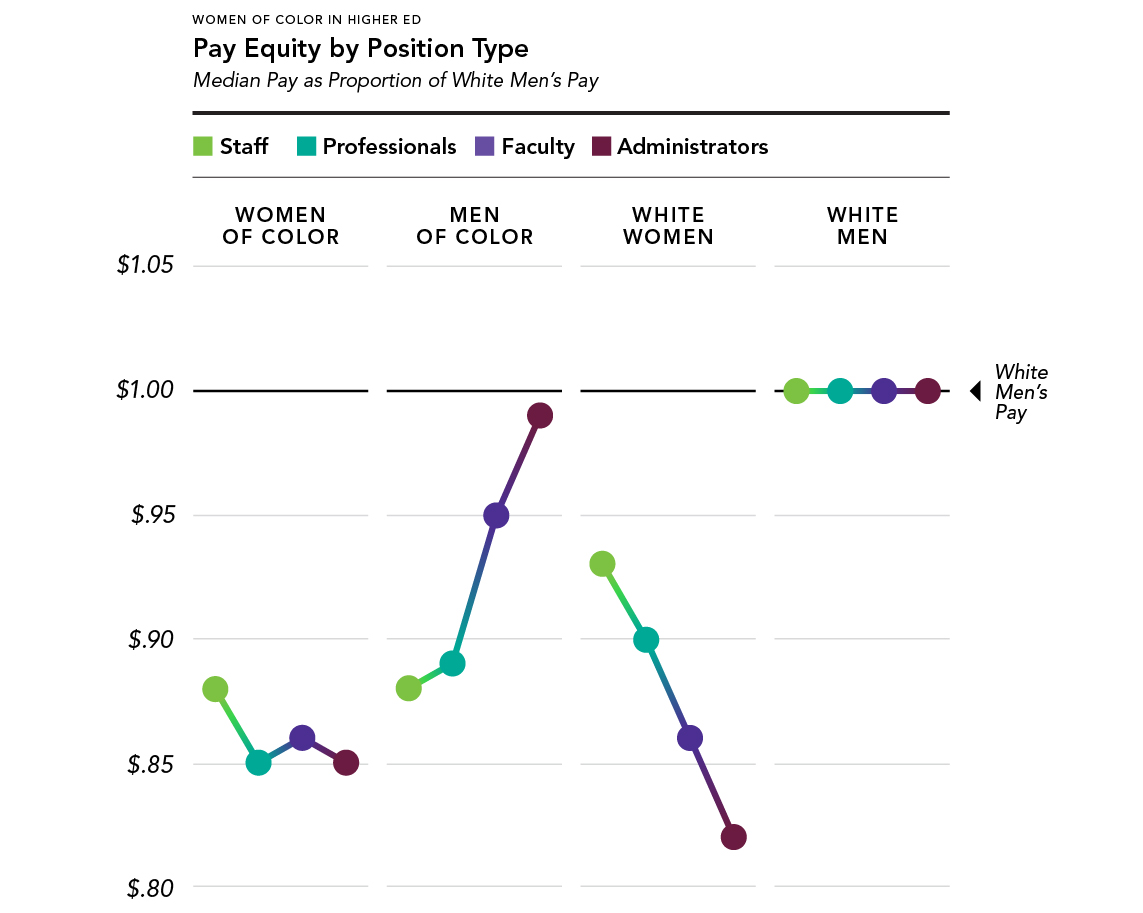
Figure 3. Pay Equity by Position Type
It’s striking that all positions show unequal pay, with White women, women of color, and men of color paid less than White men. Pay is, however, close to equitable for Black and Hispanic men in administrative positions.
If we consider the level of the position (staff, professional, or administrator) and how it relates to pay, we find two different trends in this graph: for men of color, pay equity broadly increases with position level; whereas for White women, pay equity declines.4These trends are broad, and exceptions within them certainly exist. For example, women in generally high-paying administrative roles that are predominantly filled by men are paid more equitably. However, most administrative roles that are predominantly filled by women in higher ed have a significant pay gap. (Bichsel & McChesney, 2017b.) Different kinds of bias or circumstance must be in play, and we see these intersect in the case of women of color: Across all job types, they are paid less than 90 cents on the dollar; and in each job type, they are paid the least — with the exception of administrative positions, where White women earn the least.
Representation
Figure 4 shows how much each racial/ethnic group’s representation in higher ed differs from its representation in the likely hiring pool — for staff, the U.S. population as a whole is used; for professionals, faculty, and administrators, the population holding a four-year college degree or higher is used.5Representation figures for each group are calculated by subtracting the percentage of individuals in higher ed from the percentage of individuals in the reference population.
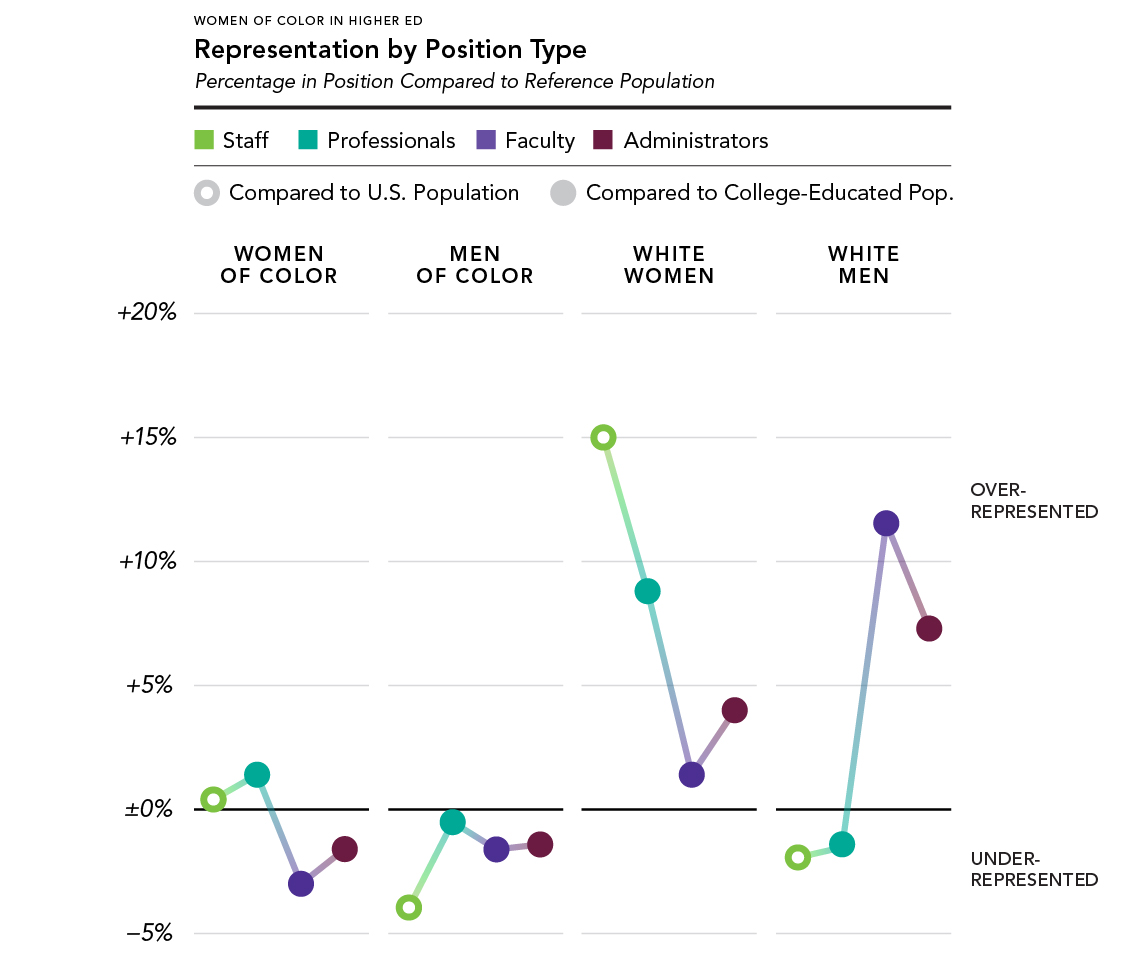
Figure 4. Representation by Position Type
What’s striking is White women’s high over-representation in staff and professional roles, and White men’s over-representation in faculty and administrative roles. For people of color, representation varies less across job position and is generally much closer to parity with the reference populations.6In earlier work, we found a much larger representation gap for racial/ethnic minority administrators, where Asians and other minorities were included. When focusing on minorities of color, as we do here, college attainment drops, and therefore so does the gap between attainment and employment in higher education. Regardless of minority status, women are less represented in faculty and administrative positions than men are, and this is probably part of a broader phenomenon, where women tend to occupy lower-paying roles than men.7The gender stereotyping of various staff and professional jobs (those considered “nurturing,” for instance) may discourage men from filling them, on one hand; and on the other, women experience many barriers to attaining jobs with more authority. See: Hill, C. (2016). Barriers and Bias: The Status of Women in Leadership (Report). AAUW.
Conclusions and Next Steps
Challenges of inequity in the higher education workforce persist, particularly for women of color. They appear to experience a combination of difficulties common to White women and minority men.
We can see this inequity most clearly in overall median pay, which remains very low for women of color. At least two factors are likely contributing to this. First, women of color are disproportionately over-represented in lower-paid positions and under-represented elsewhere. This challenge is also faced by minority men, suggesting a connection to race/ethnicity. Second, pay equity remains a challenge for women of color across job types — even in higher-level positions, they are paid considerably less than White men. This challenge is shared by White women as well, but not men of color, suggesting that gender is the key factor in pay equity. Women of color thus experience the intersection of two challenges, one owing to their gender and the other to their race/ethnicity.
Women’s reduced wages in faculty and administrative jobs may be explained by greater representation in lower-level positions within these categories. We noted this effect in previous work — for instance, that women administrators were more likely to be unit heads than college presidents; and by disproportionately occupying lower-paid positions, women’s overall pay within administration was reduced.8Bichsel & McChesney, 2017b. Men in administration (including men of color) tend to occupy higher-level roles, and are thus paid more overall. Further study will be needed to determine whether this pattern holds within faculty and other position types, but it may help explain the decline in women’s pay that accompanies increased prestige.
What all these data tell us is that equity issues cannot be understood, or likely addressed, piecemeal. We cannot address under-representation independently of pay equity, because they are intertwined. We also cannot advance equity by targeting just one group at a time. For instance, efforts designed to aid women may unintentionally target just White women, since they are currently very well represented across higher ed employees. The intersection of equity challenges faced by Black and Hispanic women similarly suggest solutions that are multi-faceted.
Here are three steps colleges and universities can consider taking:
- Evaluate internal equity for both pay and representation across different job categories. Consider demographic factors both independently and in combination.
- Compare with peer institutions using detailed and accurate salary data. In this way, ensure fair market wages for all employees and establish competitive salaries when it’s necessary to compete for a limited pool of minority candidates.
- Take analyses beyond wages and consider employee turnover, age, and experience. This may allow for a longer-term view and the ability to address the pipeline of
minority women incumbents who could potentially be promoted into higher-
prestige roles.
Equity issues cannot be solved overnight, but by planning strategically, with unbiased data, higher education institutions can continue taking steps toward more diverse and equitable campuses.
Citation for this report: McChesney, Jasper (2018, May). Representation and Pay of Women of Color in the Higher Education Workforce (Research Report). CUPA-HR.
Printer-friendly Version 1 Bichsel, J., & McChesney, J. (2017, February). The Gender Pay Gap and the Representation of Women in Higher Education Administrative Positions: The Century So Far (Research Report). CUPA-HR. Bichsel, J., & McChesney, J. (2017, March). Pay and Representation of Racial/Ethnic Minorities in Higher Education Administrative Positions: The Century So Far (Research Report). CUPA-HR. McChesney, J. (2017, August). The Representation and Pay of Women and Minorities in Higher Education Administration: Institutions That Are Getting It Right (Research Report). CUPA-HR.