
The Gender Pay Gap and the Representation of Women in Higher Education Administrative Positions
By Jacqueline Bichsel and Jasper McChesney | February 2017
Introduction
CUPA-HR is entering its 50th year of data collection; since 1967, we have been collecting data on higher education administrative positions. We have been collecting data on diversity for many years as well — we started in the 1980s with administrators and expanded to professional positions a few years ago. For the 2016-17 cycle, with a change to incumbent-level reporting, we are collecting data on gender, ethnicity, age, and years in position for all our major salary surveys: Administrators, Professionals, Staff, and Four-Year Faculty.
The decision to begin collecting this data for all higher education positions at this point is strategic.1See the following for more information about CUPA-HR’s commitment to diversity, equity, and inclusion in higher education: CUPA-HR Position Statement: Inclusion Cultivates Excellence. Diversity, equity, and inclusion efforts on campuses have increased as student bodies have increased in diversity.2National Science Foundation, National Center for Science and Engineering Statistics, special tabulations of U.S. Department of Education, National Center for Education Statistics, Integrated Postsecondary Education Data System, Completions Survey. Research in industry indicates that diversity is good for the bottom line. Diverse companies and institutions are more successful than those that are not diverse. In fact, gender-diverse companies are 15% more likely to outperform their peers, and ethnically-diverse companies are 35% more likely to outperform their peers.3Hunt, V.; Layton, D.; & Prince, S. (2015). Diversity Matters. Research Report. McKinsey & Company.
Recognition of inequity isn’t enough — diversity doesn’t take care of itself. Women remain underrepresented in top positions in industry.4Ibid. In addition, when we look at the current pay gap for full-time U.S. workers, women earn 79 cents for every $1 that men earn, which is a pay gap of 21%.5The Simple Truth About the Gender Pay Gap (2016). Report. AAUW. This gap has decreased from 59% in 1974, but it has remained steady for more than a decade.6Ibid. The pay gap is even worse for women with children and for older women.7Ibid. We have recognized that women are paid differently than men for decades, but the gender gap isn’t going away on its own.
In industry, companies are more successful when they’re diverse.8Hunt et al., 2015. It is certainly no different in higher education. Research shows that teaching and research missions are better supported when the faculty, staff, and student bodies are more diverse.9Benefits and Challenges of Diversity in Academic Settings. Report. WISELY. It’s important then to understand the progress — if any — higher ed has made in the area of diversity. CUPA-HR is publishing two research briefs on diversity in higher ed administrative positions in 2017. This first brief focuses on the gender pay gap in administrative positions. The second brief will focus on the representation of ethnic minorities in these positions.
Women with advanced degrees earn only 74 cents to the dollar of what men earn in private industry.10The Simple Truth …, 2016. Therefore, for women with more education, the pay gap is 5 cents worse. One might expect that institutions of higher education would be more equitable as employers, as they are viewed as more progressive. However, as the data in this brief show, most administrative positions in higher ed — positions generally requiring advanced degrees —demonstrate a marked (although slightly narrower) gap.
This brief provides a nuanced interpretation of how higher education has paid women in administrative positions from 2001-16.11Data analyzed in this brief are from the 2001-16 CUPA-HR Administrators in Higher Education Surveys. See the resources provided at this link for more information on the positions and other data collected in these surveys. The news isn’t all bad. Our analyses of select positions show that certain areas of higher ed administration are at least tacitly striving to better represent and retain women by paying them higher salaries, and have — for a few positions —eliminated the pay gap.
The Pay Gap in Administrative Positions
Figure 1 shows median salaries plotted in whole dollars for administrators as a group since 2001.12Find a list of the administrative positions surveyed and analyzed in this brief. Salaries for both men and women have risen steadily since 2001. Note the flattening of both men’s and women’s salaries during the recession between 2009-11. The shaded area at the bottom of the graph indicates that the pay gap in whole dollars has been fairly consistent (approximately $20,000) for the past 15 years.

Figure 1. Male and Female Salaries, 2001-1613Salaries are not adjusted for inflation.
Figure 2 shows the gap for higher ed administrators plotted as the standard ratio of what women earn on the dollar compared to men. In 2001, women earned approximately 77 cents on the dollar. That has risen slightly to approximately 80 cents in 2016. The higher education pay gap for administrators roughly mirrors the overall U.S. pay gap. Before the recession, it looked like even more progress might be made in narrowing the gap. Research shows, however, that recessions hit women and minorities the hardest on several economic indicators,14Logan, A., & Weller, C. E. (2009). The State of Minorities: The Recession Issue. Center for American Progress. and the data here indicate that the decrease in higher education funding brought about by the recession may have halted any further progress in narrowing the gap.
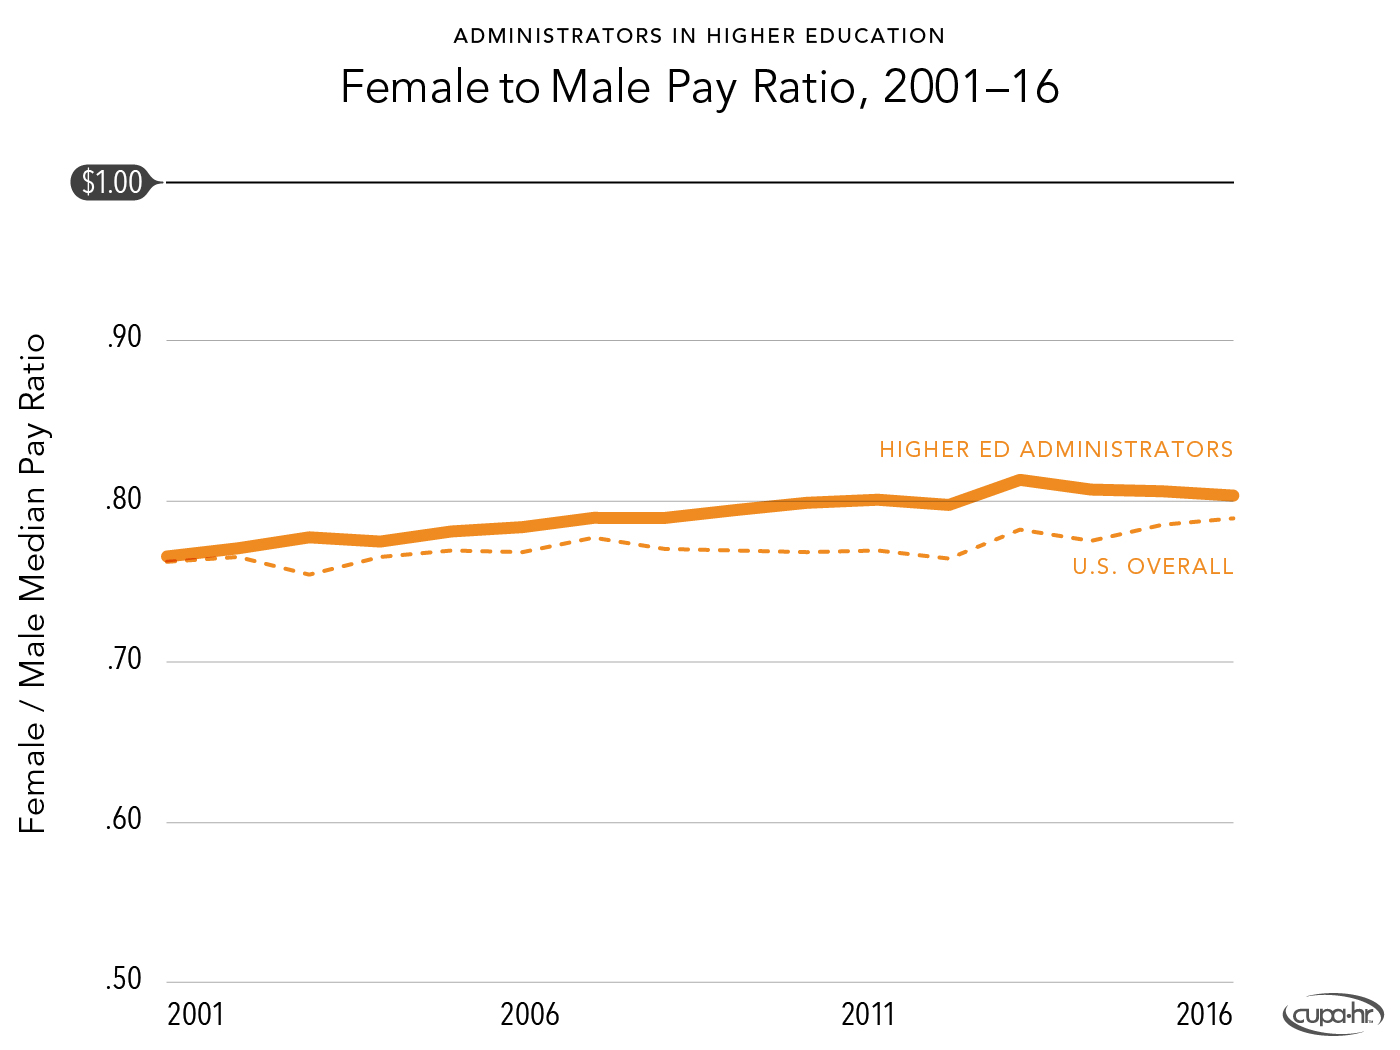
Figure 2. Female to Male Pay Ratio, 2001-1615The overall U.S. figures come from U.S. Census data.
Figure 3 shows that the 15-year pay gap in higher ed administrative positions does not vary much by region. Viewed over time, what women earn on the dollar in comparison to men increased slightly in each region up until the recession. Slopes indicate that the region making the least progress in the past 15 years is the West, although that region started 2001 with the highest female to male pay ratio. The region making the most progress is the Midwest, where the female to male ratio has risen by about 8 cents — from $.74 to $.82.
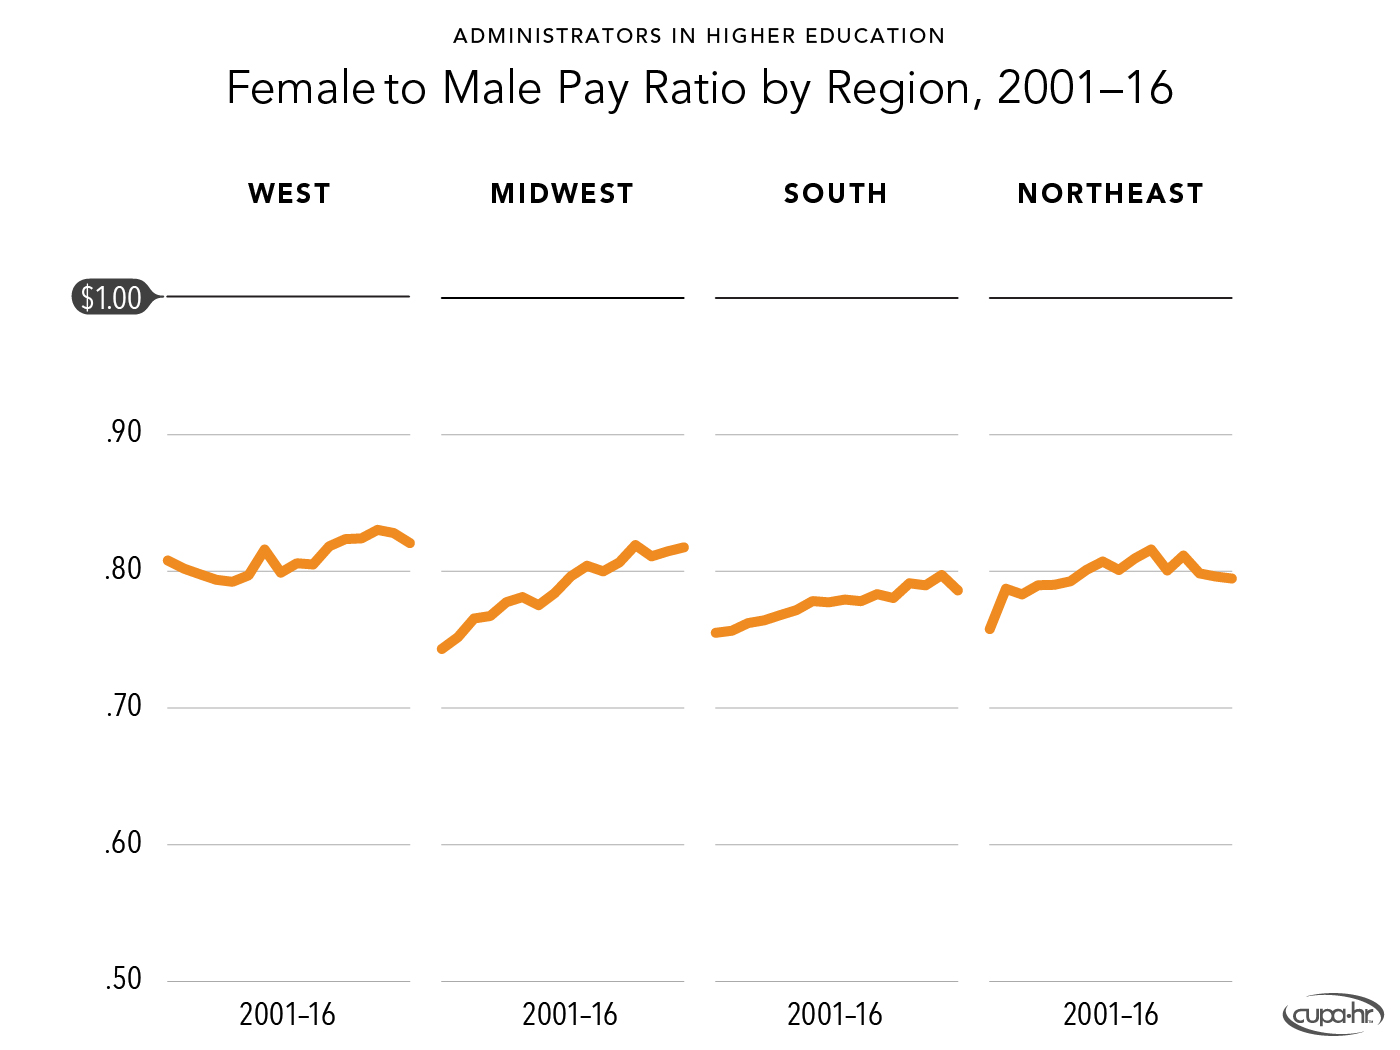
Figure 3. Female to Male Pay Ratio by Region, 2001-16
An analysis of current (2016) data indicates an overall decrease in the pay gap (increase in pay ratio) with increased seniority (measured by years of service) (Figure 4). However, this effect reverses after 17 years of service. The decrease in pay ratio at 17 years may be due to a number of factors. Research shows that individuals from older generations notice more barriers to women’s advancement,16Fingerhut, H. (2016). In Both Parties, Men and Women Differ Over Whether Women Still Face Obstacles to Progress. Pew Research Center Poll. and the U.S. pay gap is worse for older women.17The Simple Truth …, 2016. In addition, it may be the case that ageism disproportionately affects females, making the pay gap worse for older women.18McMullin, J.A., & Berger, E.D. (2013). “The Case of Unemployed Older Workers.” In Calasanti, T.M., & Slevin, K.F., Age Matters: Re-Aligning Feminist Thinking.
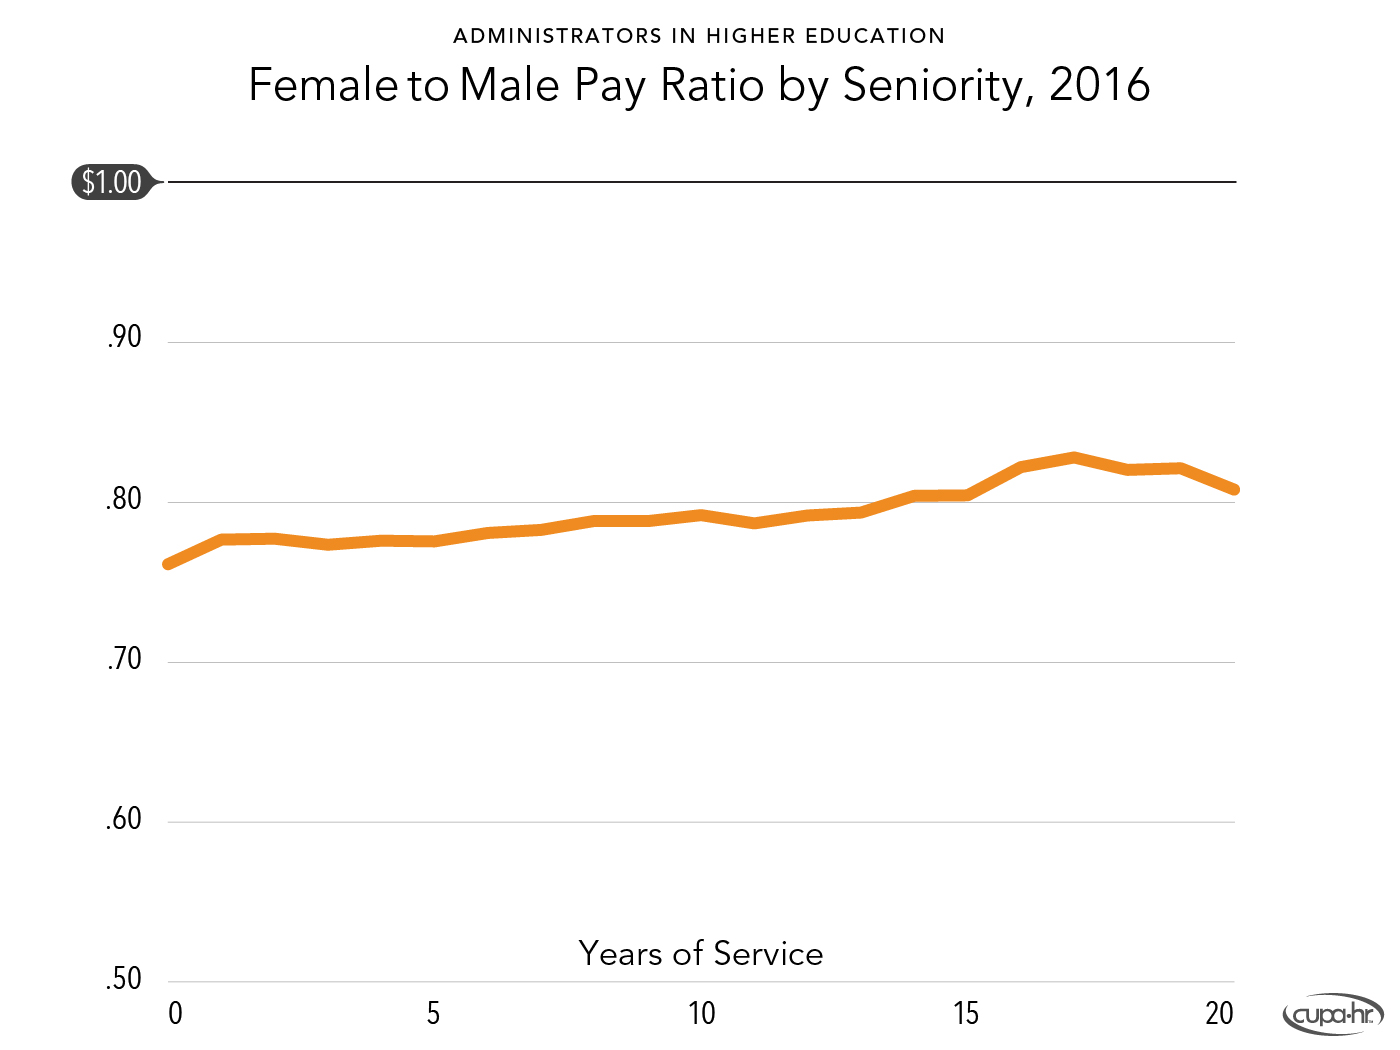
Figure 4. Female to Male Pay Ratio by Seniority, 2016
Representation of Women in Higher Education Administrative Positions
The picture is better when we look at the percentage of women in all administrative positions (Figure 5). Across the U.S., roughly half of higher ed administrators are women. Thus, if one were to assess female diversity simply by looking at the representation of women in administrative positions as a whole, we would conclude they are well-represented in each major Census region of the U.S.19See a list of states in each U.S. Census region.
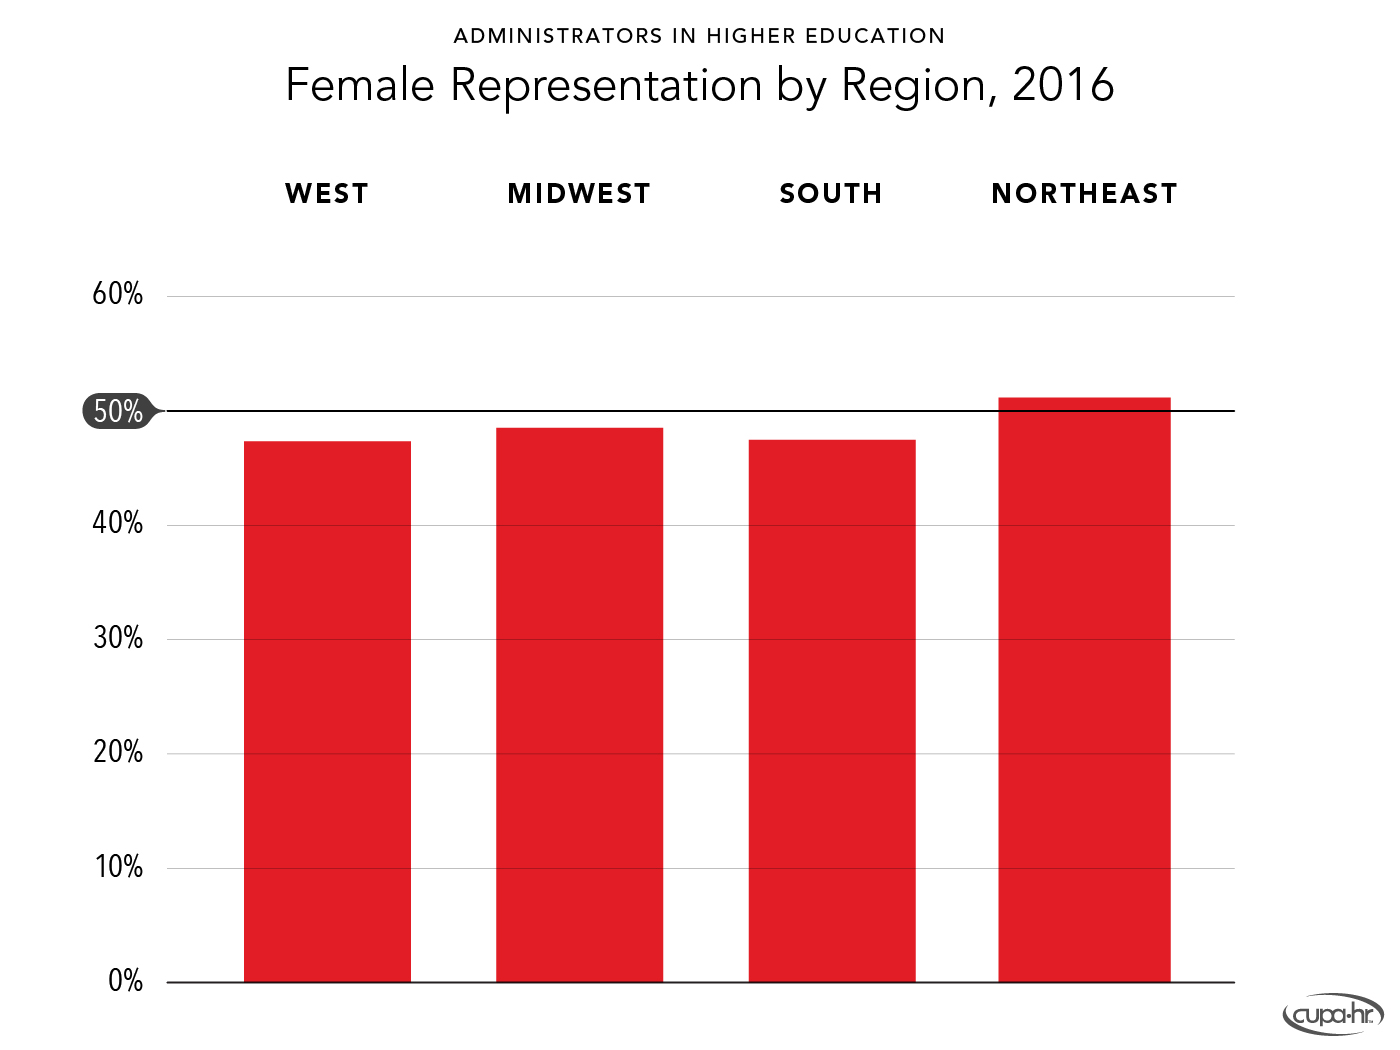
Figure 5. Female Representation by Region, 2016
However, when different types of administrative positions are assessed, we see that the representation of women decreases drastically in more prestigious, higher-paying jobs (Figure 6). Although there has been a trend toward hiring more women into each type of position since 2001, the percentage of women in top executive positions remains less than 30%.
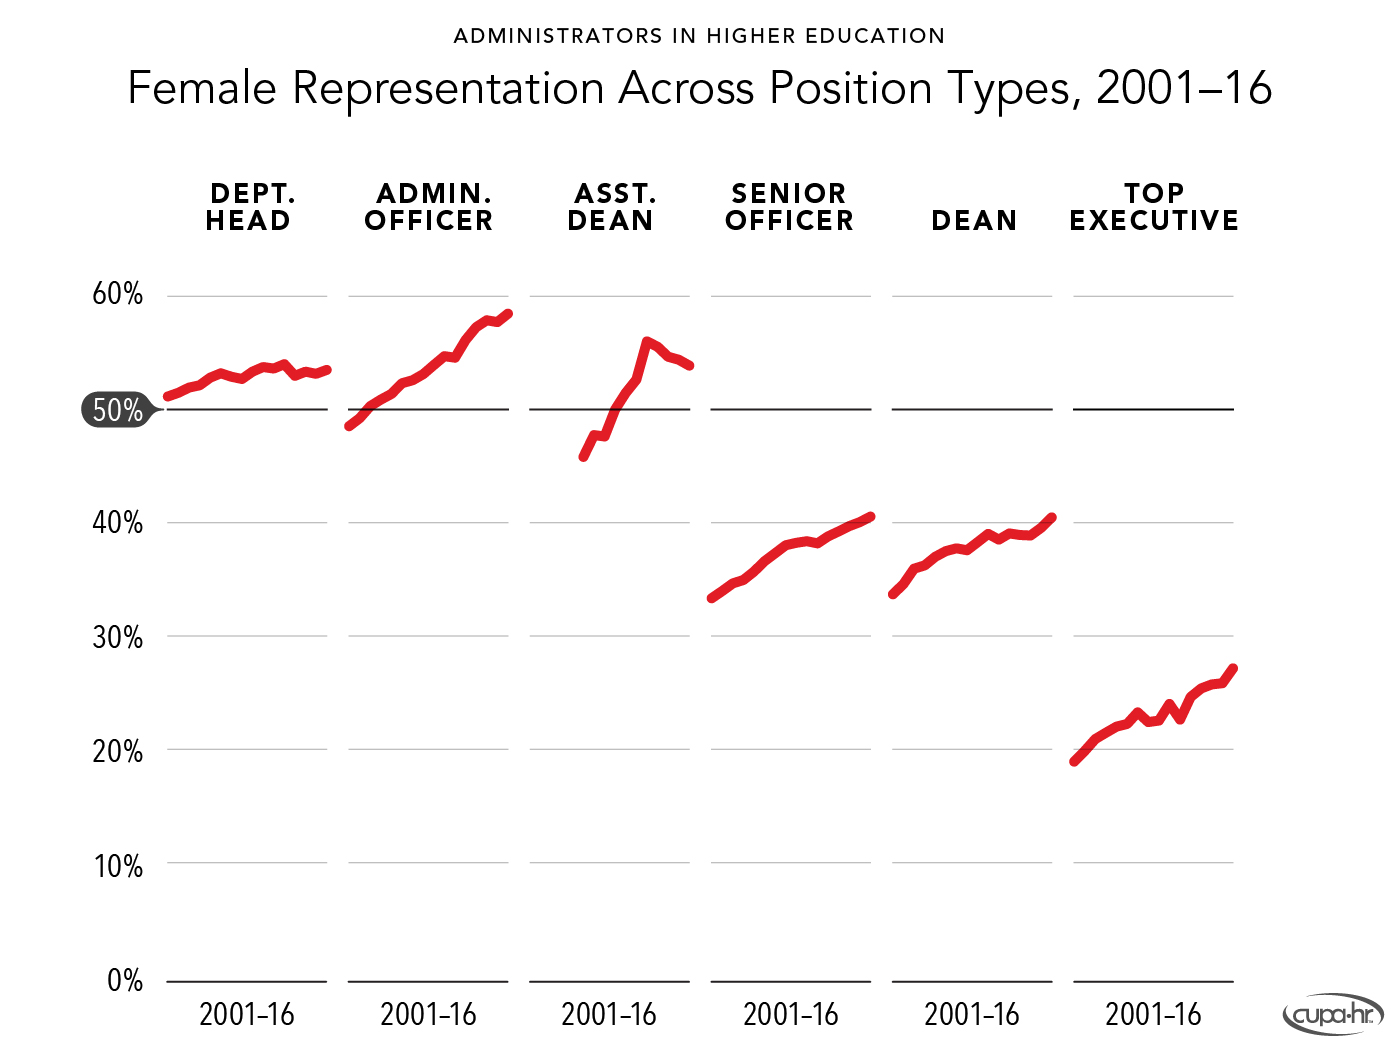
Figure 6. Female Representation Across Population Types, 2001-16
Figure 7 depicts the inverse relation between female representation and salary more starkly. In an analysis of all higher ed administrator positions, the representation of females decreases as median salary increases.
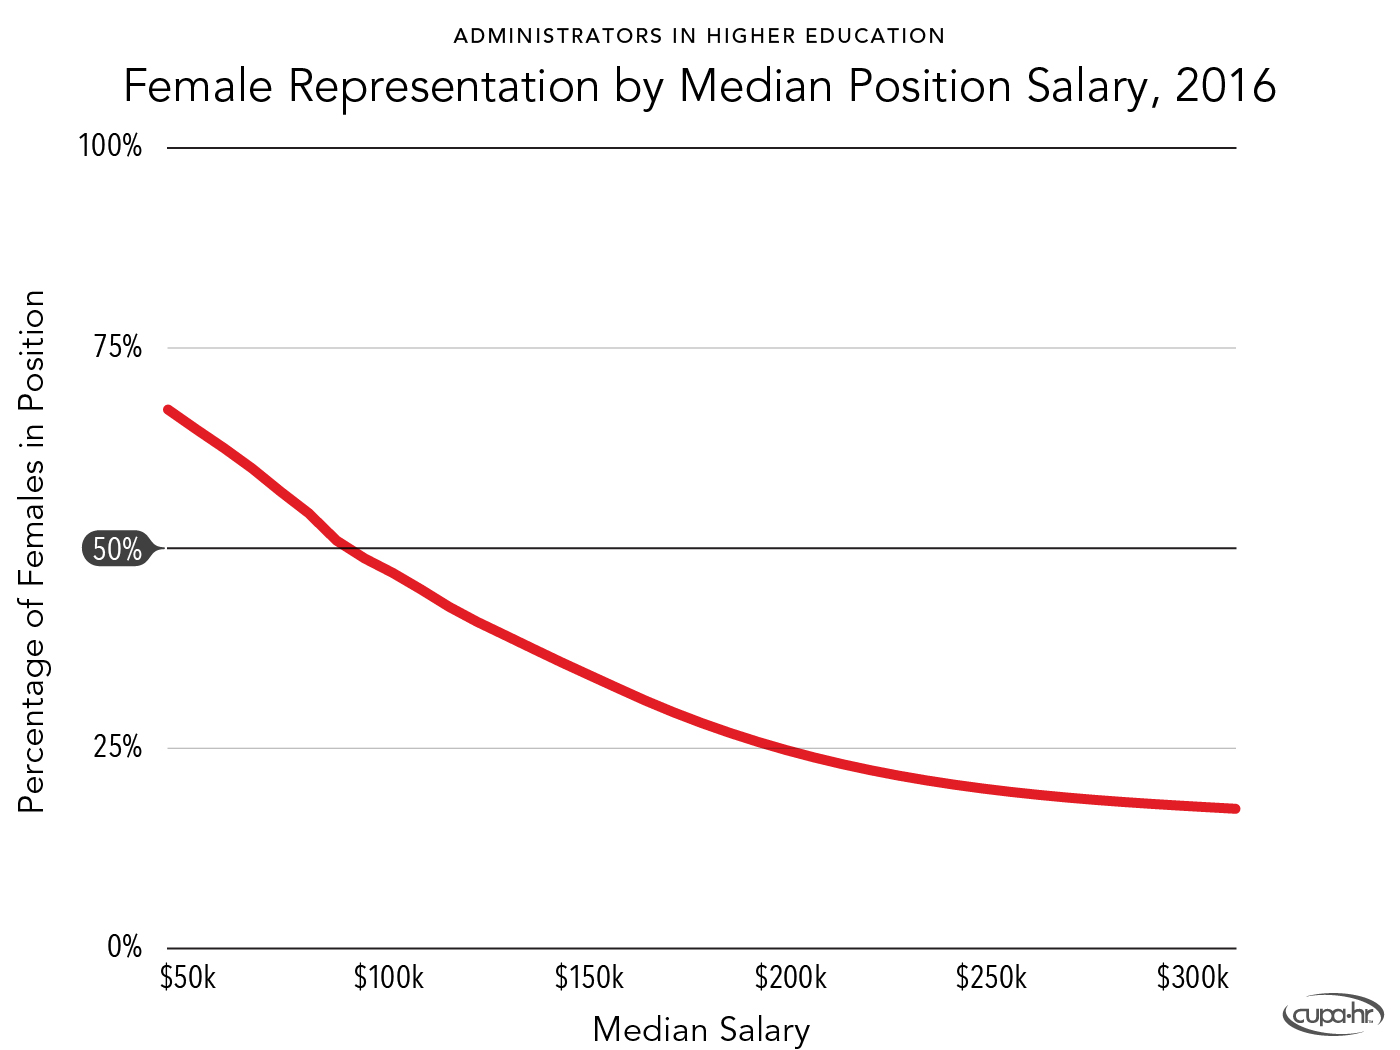
Figure 7. Female Representation by Median Position Salary, 2016
Men occupy the overwhelming majority of executive positions in higher ed (Figure 8). They outnumber women more than 2:1 among presidents and chief business officers. They outnumber women 4:1 among chief information officers and chief athletics administrators, and more than 9:1 among chief facilities officers. The only position in which women occupy the overwhelming majority of positions is that of chief HR officer, where they outnumber men nearly 3:1.
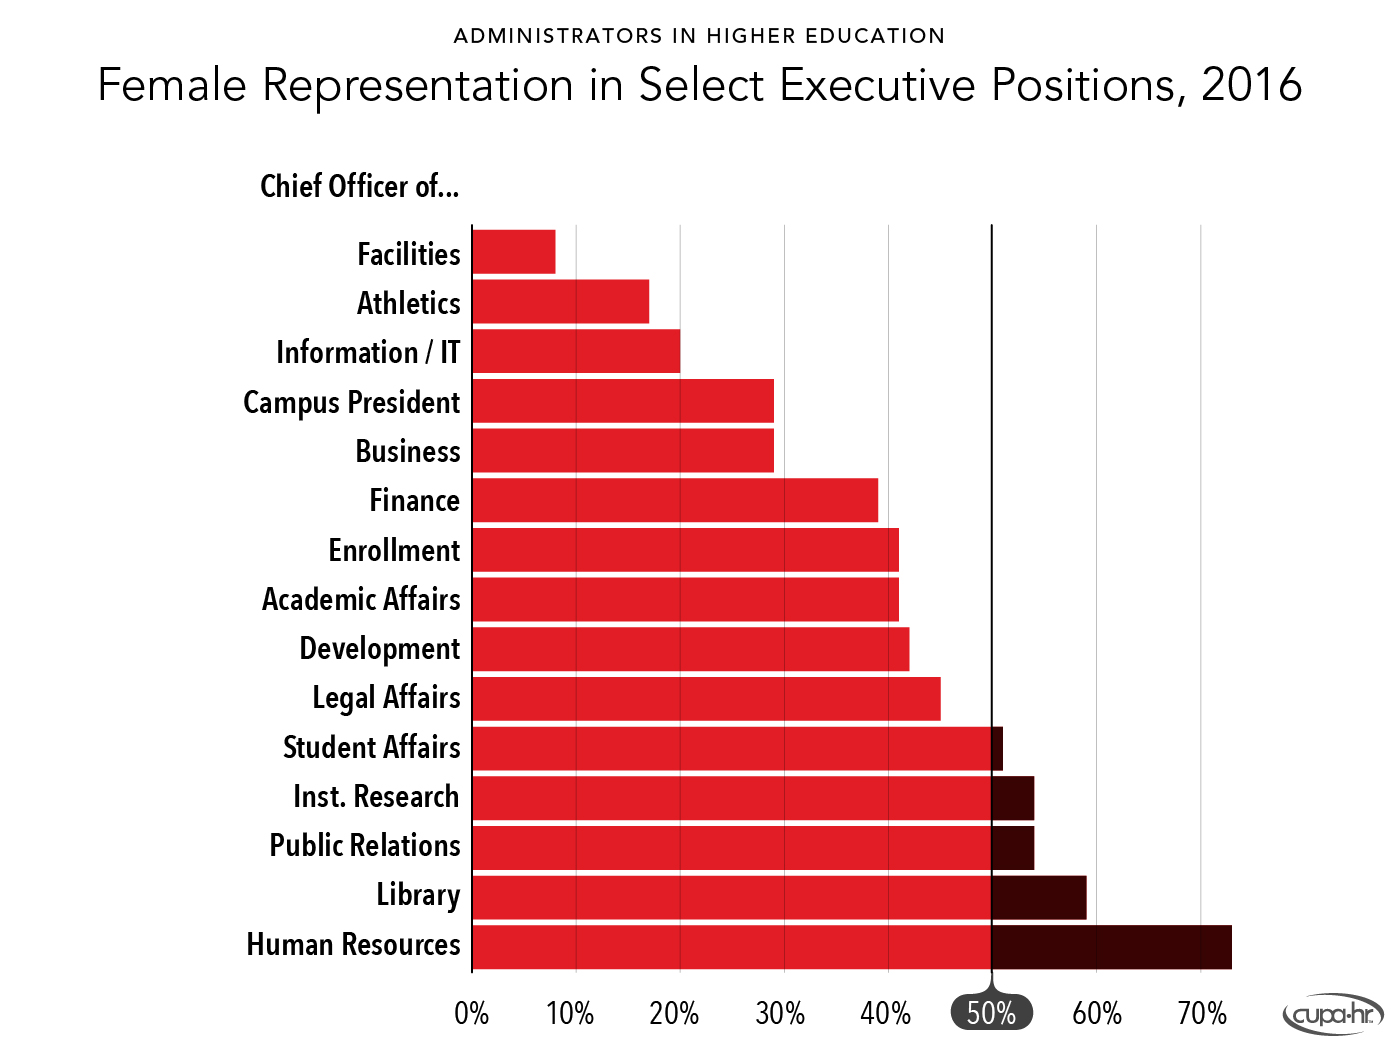
Figure 8. Female Representation in Select Executive Positions, 2016
The Relation Between Representation and the Pay Gap:
In General, Less Representation Means Higher Pay
Although the representation of women is lower in positions with higher salaries, the pay gap is narrower. The pay gap decreases slightly as one moves from less senior to more senior positions (with the exception of deans) (Figure 9). Therefore, in positions where women are less represented, they tend to be paid more.

Figure 9. Female to Male Pay Ratio by Position Type, 2016
When specific positions are examined, we see that salary gaps between men and women pervade executive positions in higher education (Figure 10). The highest gap is in the position of chief financial officer, in which women earn $.77 for every dollar that men earn. In 12 of the 15 positions reported, men earn a higher median salary than women, and in six of those positions, the difference is greater than 10%.
However, although female chief facilities officers are outnumbered more than 9:1 by men (Figure 8), they earn 17% more than their male counterparts. We see the same situation among chief information officers. It appears that in positions where women earn significantly more than men, they are also extremely underrepresented. This may indicate that — at least in some areas — higher ed institutions recognize the need to recruit and retain women to key leadership positions.
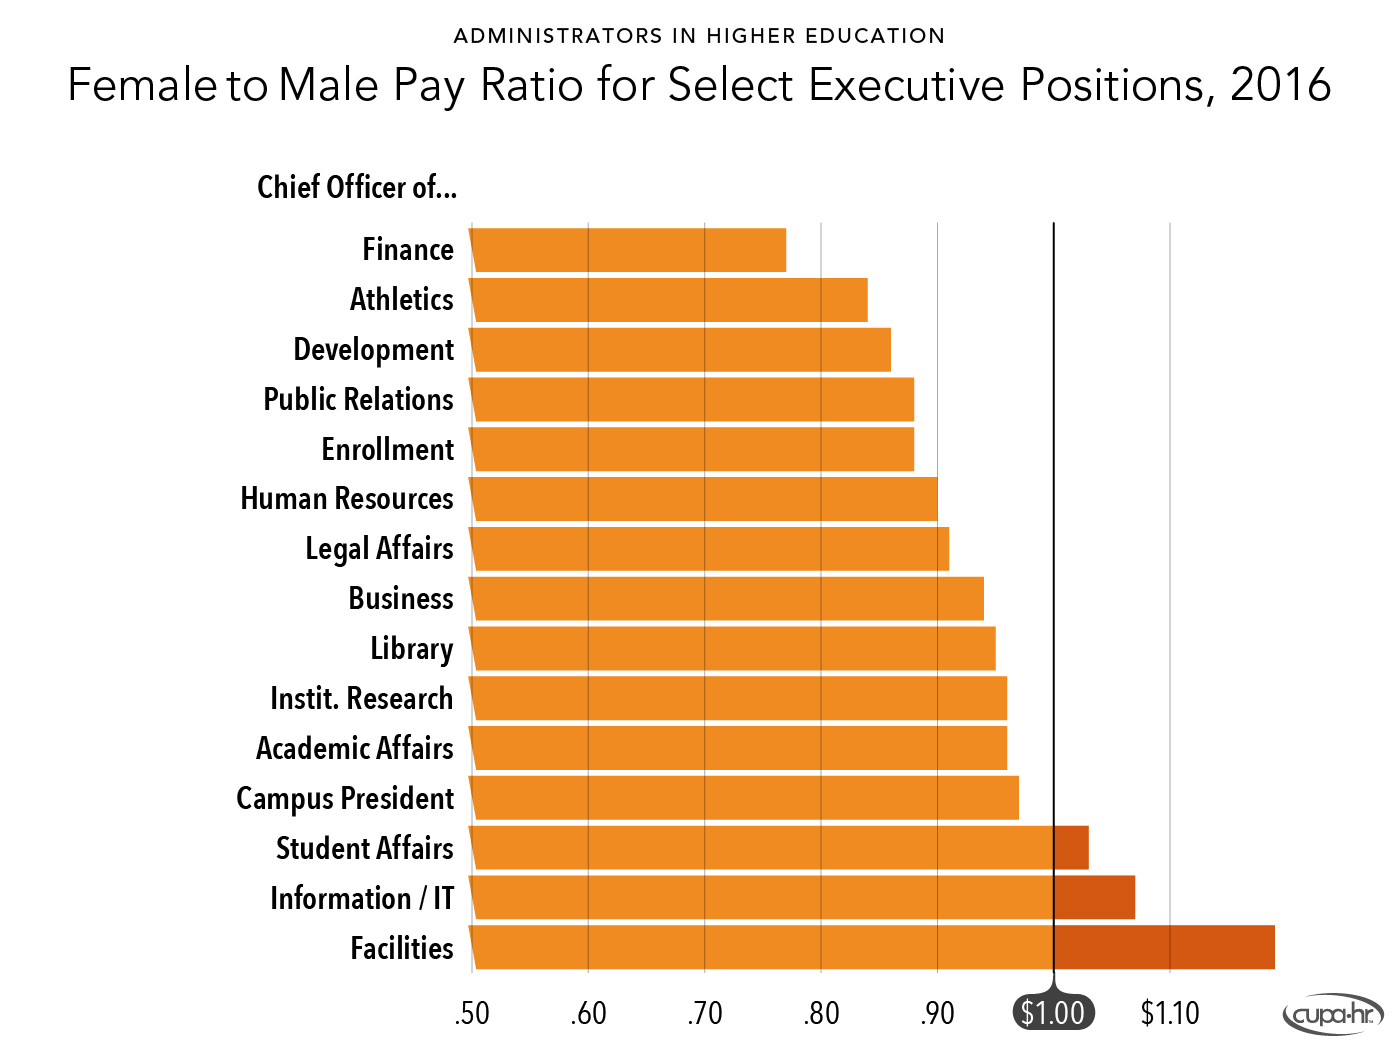
Figure 10. Female to Male Pay Ratio for Select Executive Positions, 2016
Figure 11 depicts each administrative position (represented by the dots) plotted by the percentage of women in those positions and the female to male pay ratio.20Three of these positions are labeled on the graph to represent middle and extreme values. In general, the better represented women are in a given position, the wider the pay gap (the lower their salary in comparison to men). In positions where women are less represented, the pay gap is narrower.

Figure 11. Female to Male Pay Ratio by Female Representation, 2016
Conclusion and Next Steps
We won’t solve the problems of adequate pay and representation with data alone, but information provides a vehicle to understand the extent of the problem. From the data, we can draw the following conclusions:
- The gender pay gap in higher ed administrative positions is not narrowing. It has been fairly consistent for the past 15 years.
- Women are equitably represented in administrative positions as a whole; however, there are fewer women in higher-paying leadership positions.
- In positions where women are drastically underrepresented, women are typically paid more than their male counterparts, which may indicate efforts to attract and retain women in these positions.
The data presented in this brief suggest the following next steps:
- Examine the data at your own institution to answer the following:
- How well-represented are women in administrative positions?
- Are women being paid comparably to men in similar positions?
- Benchmark your administrative salaries to compare your salaries with other institutions.21Get more information on benchmarking and participating in the CUPA-HR Administrators in Higher Education Survey.
- Recognize that representation is not the only issue for women in administrative positions. There is still a considerable pay gap in positions where women are well-represented. Identify whether such pay gaps exist at your institution.
- Inform your leadership of the data contained in this brief and the comparison data relating to your own institution. Identify any areas in need of change. This data will help leaders more fully understand the magnitude of the challenges and the importance of making needed changes.
- Based on the data, begin to identify what steps can be implemented or updated in your efforts to recruit and retain top, diverse talent.22For resources on improving diversity in recruitment efforts, visit CUPA-HR’s Diversity Resources page.
It is clear that we need a metric to measure progress on the pay gap, the representation of women, and other issues of diversity, equity, and inclusion. However, to develop such a metric, we need to define what success looks like. Consider the following question:
What does an institution need to have in place for us to consider it successful in its diversity, equity, and inclusion efforts?
We in CUPA-HR research are interested in knowing your responses to this question. We know the answers are multi-faceted and nuanced. This question is an effort to glean preliminary information that will help our research team develop more tools to assess the progress of diversity, equity, and inclusion efforts and to move those efforts from discussion to action. To provide your response and be a part of the discussion, send an email to: Jacqueline Bichsel, Director of Research, CUPA-HR, [email protected].
Citation for this report: Bichsel, Jacqueline, and McChesney, Jasper (2017, February). The Gender Pay Gap and the Representation of Women in Higher Education Administrative Positions: The Century So Far (Research Report). CUPA-HR.
Printer-friendly Version 1 See the following for more information about CUPA-HR’s commitment to diversity, equity, and inclusion in higher education: CUPA-HR Position Statement: Inclusion Cultivates Excellence.