
Skilled Crafts: The Next Job Boom in Higher Ed?
Among staff-level jobs in the nation’s colleges and universities, the skilled crafts area is growing markedly, while current skilled crafts workers are nearing retirement — making a hiring boom likely within the next decade.
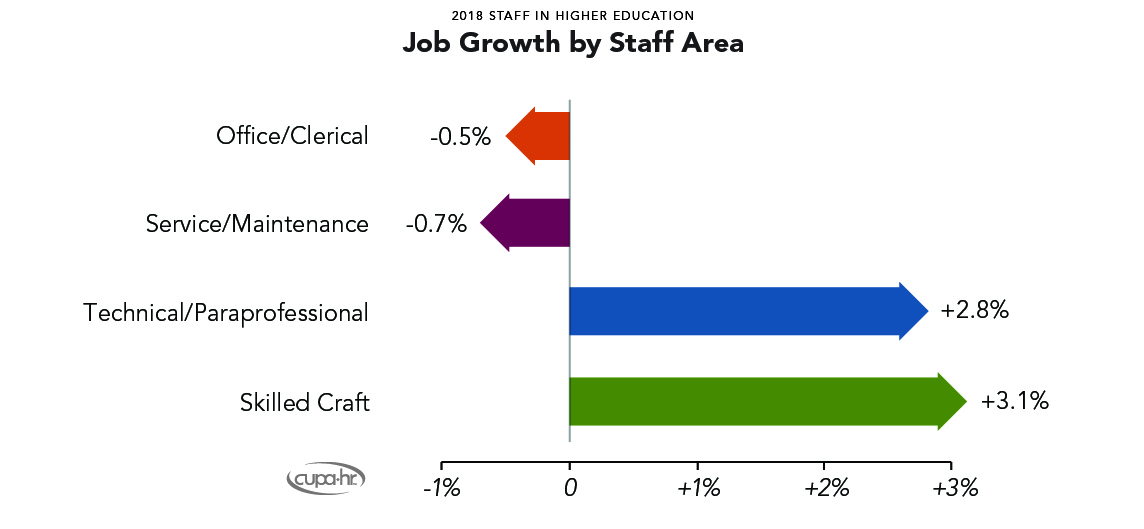
According to just-released findings from CUPA-HR’s 2018 Staff in Higher Education Survey, skilled crafts workers (who hold jobs like electrician, carpenter, machinist and metalworker) make up the smallest percentage of the staff workforce in higher ed institutions (at just 7 percent), but jobs in that area are growing at nearly triple the rate of office/clerical and service/maintenance positions combined. Nearly half of skilled crafts workers in higher ed are 55 years old or older, and these workers also have the longest tenure of all higher ed staff, as well as the highest pay.
“This year’s findings depict the perfect storm for a future workforce shortage in skilled craft positions,” says Jackie Bichsel, CUPA-HR’s director of research. “These positions are experiencing a large rate of growth, and skilled craft staff are aging and nearing retirement after a long tenure in their positions. The good news is that these findings come in time to plan and prepare for these possible shortages. Higher ed HR professionals can assess the likely impact at their own institutions, as well as whether there are enough workers in the local pipeline to fill future gaps. Those in technical colleges can assess whether current training programs and apprenticeship opportunities are enough to meet the need.”
Select Findings
Here are some other findings from this year’s survey:
Salary Increases and Job Growth
The overall median salary increase for staff in higher education over the past year is 1.9 percent. Overall, higher education staff did not see significant growth — only a marginal 0.2 percent increase from 2017 to 2018 (much lower than the 7 percent growth of the professional workforce in higher ed).
Highest- and Lowest-Paid Staff
Among the highest-paid positions for staff in higher ed are skilled craft supervisor positions. Custodial and food preparation positions have the lowest median salaries.
Largest Professional Areas
Office/clerical is the largest area of employment, making up 42 percent of the staff workforce in colleges and universities. Service/maintenance makes up about 35 percent of the staff workforce.
Representation and Pay of Women and Minorities
Overall, women make up nearly two-thirds (61 percent) of staff, yet women are paid 96 cents for every dollar earned by men. Overall, racial/ethnic minorities make up nearly one-third (31 percent) of all higher ed staff and earn 93 cents on the dollar compared to non-minorities. This pay gap is larger than for administrators or professionals in higher education, suggesting that inequality in pay for minorities is more prevalent in lower-earning positions.
Age and Years in Position
About half of all higher education staff are at least 50 years old. According to the Bureau of Labor Statistics (BLS), workers 55 years old or older made up 22.4 percent of the U.S. labor force in 2016. In the higher education staff workforce, this number is much higher, at 37 percent. Overall, higher ed staff have been in their current positions for a median of four years, a figure that is on par with the most recent data from the BLS on American workers in all industry.
Regional Differences
Staff in California and Washington, D.C. make the highest salaries, and those in Arkansas and West Virginia make the lowest. Racial/ethnic minorities make up more than half of staff in Hawaii, Washington, D.C., New Mexico, California, Texas, Maryland and Florida.
About the Survey
This year’s Staff in Higher Education Survey includes data for 193,530 staff in 152 positions at 837 institutions. In addition to salary data, the survey collects data on gender, race/ethnicity, age, and years in position at the incumbent level for all professionals.
For a list of participating institutions, a report overview, information on data collected and options for purchasing the survey report and DataOnDemand, visit the Staff in Higher Education web page.
Read about this year’s findings on administrators and professionals in higher ed and faculty survey findings around trend increases and diversity in the pipeline.
